The Turning Point: Maersk’s Sustainability Transformation

Maersk - Shipping - Carbon Emissions

The Shipping Industry Was Drowning in Promises

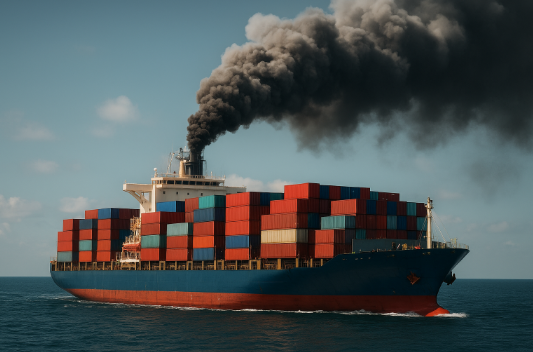
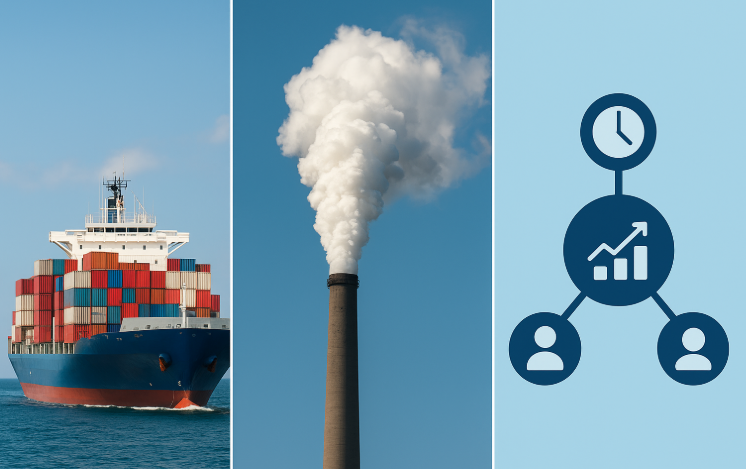
For years, global shipping—responsible for nearly 3% of global CO₂ emissions—was full of bold sustainability promises. Beautiful reports. Big pledges. Glossy infographics showing “green fleets by 2030.”

But behind the glossy covers, something was broken:
Targets existed. Systems didn’t.
Ships still burned high-sulfur fuel. Supplier audits lagged. Carbon curves refused to bend.

Across the industry, ESG performance looked more like theater than transformation.

And then came a company that refused to play along: Maersk.


The Turning Point: Maersk’s Sustainability Transformation

Maersk—the world’s largest container shipping company—realized early that environmental reporting alone wouldn’t save the oceans, or the company.

In 2018, Maersk publicly committed to a net-zero future long before its competitors.
Critics called it impossible.
Analysts called it marketing.
But inside the company, leadership knew one truth:

You can’t decarbonize a 100-year-old shipping giant using PowerPoint and passion. You need a performance system.

So Maersk redesigned the way the company worked—every ship, every port, every fuel decision, every supplier.

This was not sustainability work.
This was organizational redesign.


Maersk’s Integrated Performance System: The Real Engine Behind Change

Maersk

Maersk built one of the world’s most advanced ESG performance systems—a system that replaced “measurement theater” with daily operational discipline.

Their transformation rested on four pillars:

1. One Integrated Measurement Architecture

No more dozens of disconnected ESG metrics.
Maersk created one ESG scorecard embedded inside the business, not outside it.

This scorecard aligned strategic goals → operational KPIs → employee incentives.

Example:
If “carbon intensity reduction” was a board target, the same metric appeared on:

  • Vessel captain dashboards
  • Port manager KPIs
  • Business unit P&L reviews
  • Executive bonus scorecards

Everyone could see how today’s decisions moved tomorrow’s climate curve.


2. Unified Dashboards for Plants, Ports & Vessels

Maersk digitized real-time environmental data:

  • Fuel consumption
  • Carbon intensity
  • Voyage efficiency
  • Idle time at ports
  • Safety incidents
  • Container reuse cycles

Every ship captain, port leader, and operations manager had a dashboard that showed “Are we on track today?”

Daily performance became visible.
Daily action became possible.


3. ESG in Quarterly Business Reviews

ESG KPIs weren’t discussed in separate meetings.
They were placed directly next to:

  • Revenue
  • Margin
  • Asset utilization
  • Voyage performance

This sent a powerful message:

“ESG is not a department. ESG is how we win.”


4. Incentives That Actually Change Behavior

Maersk linked 20–30% of leadership bonuses to ESG metrics:

  • Carbon intensity
  • Alternative fuel adoption
  • Safety performance
  • Supplier compliance
  • Circular packaging targets

Executives didn’t just support sustainability—they were compensated for it.

This changed everything.


From Reporting to Reality: Outcomes of Maersk’s Integration System

ESG metrics were woven directly into daily operational dashboards — from vessel captains to terminal managers to customer teams. Monthly business reviews gave ESG the same weight as financials. Investment in AI-powered analytics helped predict risks and opportunities early, while all strategic metrics were independently assured each year for credibility.

Because ESG was embedded—not bolted on—Maersk achieved results the industry thought impossible:

⚓ 2040 Net-Zero Target (Revised From 2050)

Accelerated by a decade.

⚓ First Carbon-Neutral Container Ship (2023)

A global milestone.

⚓ Methanol-Powered Fleet Expansion

180+ methanol-ready ships ordered.

⚓ Fuel Efficiency Gains

New routes and speed optimization cut fuel use and emissions simultaneously.

⚓ Supplier Accountability Strengthened

Tier-1 and Tier-2 vendors scored, benchmarked, and contractually tied to ESG performance.

Maersk proved that shipping can grow while decarbonizing—if ESG is integrated into the operating system.


From Maersk to Every Industry: How Companies Can End “Measurement Theater”

Here is the blueprint for any company to replicate Maersk’s transformation.


I. 8–10 Strategic Board-Level ESG Metrics

Used for quarterly governance and long-term oversight.

Climate & Energy

  1. Scope 1 emissions intensity
  2. % low-carbon / alternative fuel mix

Resource Efficiency

  1. Waste-to-landfill reduction
  2. Water intensity per unit

Value Chain & Procurement

  1. % ESG-compliant Tier-1 and Tier-2 suppliers

Workforce & Safety

  1. LTIFR (lost-time injury rate)
  2. % women in critical leadership roles
  1. ESG cost savings
  2. ESG-adjusted EBITDA
  3. % variable compensation tied to ESG milestones

These KPIs ensure the board moves from awareness to accountability.


II. Operational KPIs by Business Segment

A. Shipping & Logistics

  • Carbon intensity per ton-mile
  • Fuel efficiency per voyage
  • Low-sulfur/biofuel usage
  • Idle time at ports
  • Vessel route optimization score

B. Manufacturing & Ports

  • Energy use per shift
  • Renewable energy share
  • Water recycling rate
  • Scrap & waste generation
  • Safety observations and near-miss reporting

C. Procurement/Supply Chain

  • Supplier ESG score
  • On-time delivery from compliant vendors
  • Recycled material content
  • Spend covered under sustainable contracts

D. Sales & Customer Operations

  • % revenue from green solutions
  • Customer carbon savings
  • Circular packaging adoption

Operational KPIs drive daily decisions, not annual reporting.


III. Embedding the Metrics into the Operating Rhythm

Plant Managers’ Dashboards

Visible daily:

  • Energy
  • Carbon
  • Waste
  • Water
  • Safety

Shift cannot close if deviations aren’t addressed.

Business Unit Reviews

Quarterly reviews cover:

  • ESG-adjusted P&L
  • Supplier risk tied to sustainability
  • Fuel and energy savings impact on margin

Executive Compensation

20–30% linked to ESG targets.
No target = lower bonus.

That’s when behavior changes fast.


Why This Works

Because people don’t follow what you say.
They follow what you measure.
And what you reward.

Maersk didn’t just commit to sustainability.
Maersk redesigned the way the company works.


Closing: The Lesson for Every Industry

If the world’s largest shipping company—moving 1 in 5 containers globally—can decarbonize through an integrated performance system, any company can.

The difference between measurement theater and real performance is simple:

Integration. Accountability. Daily action.


🔔 A Call to Action for Every Stakeholder

For Boards

Demand clarity, not clutter.
Choose eight metrics that truly matter.
Link ESG to strategy, capital allocation, and CEO evaluation.
If a metric doesn’t drive action — remove it.

For Executives

Stop treating ESG as a side deck.
Build an operating system where sustainability KPIs sit next to financial KPIs — every month, every business review, every decision.

For Plant Managers & Operators

Own the metrics that move the needle.
Fuel efficiency, safety, waste reduction, supplier compliance —
ESG is not extra work. It’s smarter work.

For Employees

Your daily choices shape the company’s destiny.
Ask: “Does my decision today move us closer to our commitments?”
Culture changes when people believe their actions matter.

For Investors

Reward companies that measure what matters.
Look for real performance, not glossy reports.
Demand transparency, assurance, and proof of value creation.

For Suppliers & Partners

Sustainability is now table stakes.
Rise with your customers — innovate, certify, digitize, and eliminate risk from the chain.

For Policymakers & Regulators

Create simple, consistent, outcome-based rules.
Support innovation, ensure accountability, and accelerate transition in hard-to-abate sectors.


🌍 Final Call: This Transformation Needs All of Us

Real ESG impact is never created in boardrooms alone.
It happens on ships, in plants, across supply chains, within teams, and through shared ambition.

If we measure with discipline, act with integrity, and align around a common purpose — performance follows.
And transformation becomes inevitable.

Read more blogs on sustainability here. External Reference link.

7 Powerful ESG Reporting Tools Companies Trust

ESG Reporting Tools

The CFO stared at the screen.

Thirty-two spreadsheets.
Seven data owners.
Four versions of emission numbers.
One reporting deadline, just nine days away.

Finance had one carbon figure. Operations reported another. HR, Procurement, and Admin each had their own dashboards. Nothing aligned. Everything conflicted. And the audit team was already asking for evidence trails the company simply didn’t have.

In that moment, the problem became painfully clear:

The company didn’t have an ESG strategy problem.
It had an ESG systems problem.

Across India, Europe, the U.S., and Southeast Asia, this exact moment has pushed thousands of organisations to modernise their sustainability reporting. ESG can no longer run on scattered spreadsheets — not when BRSR, GRI, ISSB, CSRD, TCFD, and GHG Protocol require accuracy, traceability, and audit-ready data.

To solve this, companies have turned to a mix of seven proven ESG reporting tools, each used by recognizable global brands — publicly verified.

This blog breaks down:

  • ✔ The 7 ESG tools companies actually use (real examples)
  • ✔ How each tool helps with BRSR, GRI, ISSB, GHG, TCFD reporting
  • ✔ When each tool is preferred
  • ✔ A complete roadmap for ESG reporting digitalisation
  • ✔ Step-by-step guide to extract reports from SAP Sustainability Control Tower (SCT)
  • ✔ Benefits, limitations, and integration options
  • ✔ Final business-focused insights + CTA

Let’s begin.


🌱 The 7 ESG Reporting Tools Companies Actually Use

These tools are listed only because their usage is publicly documented through case studies, press releases, investor reports, or sustainability publications.


1. SAP Sustainability Control Tower (SAP SCT)

Used by: Bosch, SAP SE, BMW Group (Public SAP case studies)

What it does:

A unified ESG data platform that consolidates environmental, social, and governance metrics into a single “source of truth.”

Best for:

Large enterprises running SAP ERP, SAP S/4HANA, SAP EHS, SAP Ariba, SAP SuccessFactors.

Strengths:

  • Built-in ISSB, GRI, CSRD, GHG Protocol mapping
  • Unified ESG Metric Model
  • Carbon accounting, segregation, material traceability
  • Strong data lineage for audit

Limitations:

  • Best suited when SAP is already the backbone system
  • Requires setup & configuration effort

2. Workiva

Used by: Schneider Electric, HDFC Bank, Coca-Cola, Nasdaq (Public case studies)

What it does:

A cloud platform for financial + ESG reporting, with powerful collaboration and audit trails.

Best for:

Companies preparing BRSR, GRI, ISSB, CDP, CSRD, Integrated Reporting, and Annual Reports.

Strengths:

  • Strong assurance workflows
  • Document linking — one change updates all reports
  • Excellent for regulatory submissions

Limitations:

  • Not a carbon accounting engine
  • Needs integration with ERP systems

3. Microsoft Cloud for Sustainability

Used by: Unilever, Walmart, Ørsted (Public Microsoft case studies)

What it does:

Automates emissions calculation, data ingestion, dashboards, and reporting compliance.

Strengths:

  • Integrates with Microsoft 365 ecosystem
  • Good multi-system ingestion
  • AI-based anomaly detection

Limitations:

  • Still maturing for ISSB-level disclosures
  • Needs integration for social and governance metrics

4. Enablon (Wolters Kluwer)

Used by: BP, Chevron, Dow (Public case studies)

What it does:

A leading EHS & ESG risk management system with strong compliance features.

Strengths:

  • Excellent for industrial sectors
  • GHG Protocol built-in
  • Advanced assurance audit trails

Limitations:

  • Heavily focused on EHS compared to full ESG reporting

5. SpheraCloud

Used by: Bridgestone, Maersk, PepsiCo (Public case studies)

What it does:

LCA, emissions, supply-chain sustainability, and product footprinting.

Strengths:

  • Deep lifecycle analysis
  • Product-level carbon footprints
  • Science-based modelling

Limitations:

  • More technical; less narrative-reporting oriented

6. EcoVadis

Used by: Unilever, Metro AG, Johnson & Johnson (Public EcoVadis references)

What it does:

Supply-chain ESG scoring platform.

Strengths:

  • Widely used for supplier ESG assessments
  • Global scoring methodology

Limitations:

  • Not a full corporate reporting system (more supplier-focused)

7. Tableau + Power BI (Custom ESG Dashboards)

Used by: Deloitte, KPMG clients, multiple large enterprises (publicly referenced)

What they do:

Analytics tools used for visualising ESG metrics extracted from ERPs, ESG systems, or spreadsheets.

Strengths:

  • Flexible dashboards
  • Strong visual storytelling
  • Useful for management reporting

Limitations:

  • Not compliance-focused
  • No official reporting frameworks built-in

🧭 When Companies Prefer Which Tool

ScenarioIdeal ToolWhy
SAP-heavy organisationSAP SCTSeamless data flow, automated mapping
Strong financial + regulatory reportingWorkivaPerfect for assurance, filings
Retail or CPG with global supply chainsMicrosoft SustainabilityWide integrations, scalable
Industrial, oil & gas, manufacturingEnablonStrong EHS + risk coverage
Product-based carbon footprintsSpheraBest-in-class LCA modelling
Supplier ESG evaluationsEcoVadisRecognised global rating system
Multi-system analyticsPower BI / TableauFlexible visualization

🧩 Complete Roadmap for ESG Reporting Digitalization

This is the roadmap used by companies implementing ESG reporting across multiple frameworks:


Phase 1 — Strategy & Materiality

  • Identify required frameworks: BRSR, GRI, ISSB, TCFD, GHG, CDP, UNSDGs
  • Run stakeholder consultations
  • Prioritise 25–60 core KPIs

Phase 2 — Data Inventory & Gap Analysis

  • Identify data sources in Finance, HR, EHS, SAP MM, SAP Ariba, IoT, energy meters
  • Evaluate missing data fields
  • Define baseline year

Phase 3 — Tool Selection

Based on:
✔ System landscape
✔ ESG maturity
✔ Data governance strength
✔ Team size
✔ Budget
✔ Regulatory complexity


Phase 4 — Integration & Mapping

  • Map ERP fields to ESG KPIs
  • Connect APIs, data connectors
  • Enable automated data ingestion

Phase 5 — Framework Activation

Activate frameworks inside the tool:
✔ BRSR Core + Comprehensive
✔ GRI Universal + Topic Standards
✔ ISSB IFRS S1 + S2
✔ GHG Protocol Scopes 1–3
✔ TCFD pillars


Phase 6 — Reporting & Assurance

  • Generate pre-built templates
  • Evidence attachments
  • Auditor workflow
  • Version control
  • Board approval

🏗 Detailed SAP SCT Configuration & Report-Extraction Steps

SAP SCT is often the “central brain” of ESG reporting for SAP-driven companies.
Below are real, accurate steps (safe to publish):


STEP 1 — Activate SAP Sustainability Control Tower

In SAP BTP Cockpit:

  • Assign Sustainability Administrator role
  • Deploy SCT service instance
  • Configure sub-accounts & entitlements

STEP 2 — Set Up the Unified ESG Metric Model

This is the core of SCT — a structured library where all ESG KPIs live.

You configure:

  • Indicator definitions (e.g., GHG, DEI, waste, water)
  • Dimensions (business unit, facility, geography)
  • Units, formulas, normalization logic
  • Qualitative vs quantitative fields

STEP 3 — Framework Activation

Enable official frameworks in SCT:

  • BRSR
  • GRI 2021
  • ISSB IFRS S1 & S2
  • GHG Protocol
  • UN SDGs

Each framework loads with predefined metrics, disclosure questions, and mapping fields.


STEP 4 — Data Mapping

In Data Mapping Workspace:

  • Map SAP S/4HANA fields (e.g., energy consumption, procurement spend)
  • Map HR data from SuccessFactors
  • Map emissions from EHS or IoT systems
  • Map procurement supplier ratings (e.g., EcoVadis data)

STEP 5 — Data Integration

Use:

  • SAP Integration Suite
  • SAP Data Intelligence
  • SAP Connectivity Service
  • API-based ingestion
  • File-based ingestion (CSV/XLS)

Data flows into fact tables inside SCT.


STEP 6 — Consolidation & Validation

  • Multi-entity rollup
  • Time-period alignment
  • Unit conversions
  • Evidence attachments
  • Audit logs

STEP 7 — Report Extraction

SAP SCT auto-generates reports for:

📄 BRSR Core & Comprehensive

  • Section A, B, C
  • Governance metrics
  • Social metrics
  • Environmental data

📄 GRI (Universal + Topic Standards)

  • GRI 2 (General)
  • GRI 3 (Materiality)
  • GRI 302, 305, 403, 401 etc.

📄 ISSB (IFRS S1 & S2)

  • Climate governance
  • Risk management
  • Industry metrics
  • Scope 1, 2, 3 emissions

These are exported as:

  • Word
  • PDF
  • Excel
  • XBRL (via SAP partner integrations)

📘 How Other Tools Extract ESG Reports

Below is a compact guide:


Workiva (HDFC Bank, Schneider Electric)

✔ Use ESG Reporting Module
✔ Map GRI, SASB/ISSB, BRSR metrics
✔ Link data tables to narrative reports
✔ Export to XBRL, PDF, annual report formats

Best for assurance-heavy companies.


Microsoft Cloud for Sustainability (Unilever, Walmart)

✔ Automated ingestion from meters & IoT
✔ Emissions calculation engine
✔ Sustainability scorecards + dashboards
✔ Export for ISSB, GRI, CDP submissions

Best for retail and CPG.


Enablon (BP, Chevron, Dow)

✔ Energy, emissions, EHS data ingestion
✔ GHG Protocol Scope 1-3 engine
✔ Risk-based reporting
✔ Audit-ready disclosures

Best for oil & gas + industrials.


SpheraCloud (Bridgestone, Maersk)

✔ LCA modelling
✔ Product footprinting
✔ Supplier data collection
✔ Export lifecycle emissions for GRI, ISSB

Best for product companies requiring LCA.


EcoVadis

✔ Supplier ESG scorecards
✔ Reports for BRSR/GRI supplier metrics

Best for procurement-focused organisations.


🏁 FINAL SECTION — The Business Outcome

When companies implement a unified ESG reporting system:

  • ✔ Reporting cycle drops from 120 days → 30 days
  • ✔ Audit time drops by 40–60%
  • ✔ Data accuracy improves 20–35%
  • ✔ Board confidence increases
  • ✔ Investor trust strengthens

Sustainability stops being a compliance burden — and becomes:

a financial enabler,
a risk-reducer,
and a reputational differentiator.


📣 CALL TO ACTION — For Business Leaders, CFOs & Sustainability Heads

If your ESG reporting still depends on spreadsheets, scattered teams, and manual reconciliations, this is your moment to modernise.

👉 Assess your current ESG maturity
👉 Choose the right tool for your landscape
👉 Build a unified data model
👉 Automate BRSR, GRI, ISSB, GHG & TCFD reporting
👉 Strengthen audit trails
👉 Reduce ESG risk and enhance investor confidence

The companies that move first will lead the future.
The ones that delay will fall behind regulatory pressure.

If you need help understanding tools, workflows, or setup options —
I can generate personalised guidance for your sector, tool selection, or ESG roadmap.

Read more blogs on sustainability here.

  • Workiva — overview of ESG reporting features and adoption by global firms Sustainability Magazine
  • Workiva case study: Integrated ESG reporting for a chemical company (shows Workiva used for ESG reporting) Eliassen Group
  • Workiva + CDP disclosure support — showing how Workiva integrates ESG reporting with global disclosure frameworks Workiva Newsroom
  • Reports on Workiva’s scale / customer base / global usage — demonstrating widespread adoption of Workiva for ESG & financial reporting. MarketScreener

🌍 How Companies Extract ESG Reports Using SAP Sustainability Control Tower (SCT)

SAP SCT

This includes setup, configuration, framework activation, mapping, data integration, consolidation, and report extraction for BRSR, GRI, ISSB, GHG Protocol, and TCFD.

Table of Contents


WHY ESG REPORTING IS NO LONGER OPTIONAL

Across industries—from manufacturing and energy to retail and BFSI—ESG reporting has shifted from a boardroom afterthought to a business-critical requirement.

Regulators require BRSR, global investors request GRI and ISSB, and customers demand transparent emissions and supply-chain sustainability.

But as companies begin their ESG journeys, they quickly realize:

Spreadsheets break. Data is scattered. Assurance is impossible. Reporting becomes chaos.

This is why global and Indian enterprises with SAP landscapes increasingly adopt SAP Sustainability Control Tower (SCT) as their ESG reporting backbone.

This blog provides a comprehensive roadmap, detailed configuration steps, and real extraction workflows for ESG frameworks using SAP SCT.


🏗️ SECTION 1 — WHAT IS SAP SUSTAINABILITY CONTROL TOWER (SCT)?

SAP SCT is a cloud-based ESG reporting platform that:

Integrates SAP & non-SAP systems

Energy, waste, HR, finance, procurement, emissions, EHS, logistics

Centralizes all sustainability metrics

Environmental, Social, Governance indicators from multiple frameworks

Provides pre-built frameworks

  • BRSR (India)
  • GRI
  • ISSB S1 & S2
  • GHG Protocol
  • TCFD
  • SASB
  • EU CSRD ESG metrics

Delivers audit-ready reporting

Built-in approvals, versioning, lineage, data quality checks

Supports automated extraction

PDF, Excel, Word, dashboard & API output

Many companies adopt SCT because it becomes the “single source of truth” for sustainability reporting across regulatory, voluntary, and investor frameworks.


🚀 SECTION 2 — THE COMPLETE ROADMAP FOR ESG REPORT EXTRACTION USING SCT

Below is the recommended end-to-end implementation journey:


PHASE 1 — Foundation Setup

1. Define ESG Reporting Scope

Identify which frameworks are relevant:

  • Mandatory: BRSR
  • Voluntary: GRI
  • Investor-driven: ISSB, SASB
  • Climate-risk: TCFD
  • Carbon: GHG Protocol

2. Create Unified ESG Data Dictionary

For each KPI define:

  • Metric description
  • Methodology
  • Unit
  • Frequency
  • Source system
  • Data owner
  • Calculation rules
  • Assurance controls

This becomes your “ESG Bible”.

3. Perform Materiality Assessment

  • Identify key topics relevant to stakeholders
  • Supports GRI, ISSB, and BRSR Leadership reporting

PHASE 2 — System Integration

4. Integrate Core SAP Systems

SCT integrates with:

  • SAP S/4HANA → procurement, energy, materials
  • SAP EHS → incidents, waste, compliance
  • SAP SuccessFactors → attrition, diversity, training
  • SAP Ariba → suppliers, Scope 3 inputs
  • SAP Concur/Travel → business travel emissions
  • SAP PaPM → sustainability allocations
  • SAP Analytics Cloud (SAC) → dashboards

5. Connect Non-SAP Systems

Via:

  • CSV uploads
  • APIs
  • Excel templates
  • Partner connectors

PHASE 3 — ESG Framework Activation & Configuration

This is where SCT becomes powerful.

Each ESG framework must be activated and mapped.


🌿 SECTION 3 — DETAILED SAP SCT SETUP & CONFIGURATION STEPS

Below are the step-by-step configurations to extract BRSR, GRI, ISSB, GHG Protocol, and TCFD reports.


A. CONFIGURATION STEPS FOR BRSR IN SAP SCT

Step 1 — Activate BRSR Framework

Navigate to:
Governance → Framework Management → Add Framework → Select BRSR

SCT loads all indicators for:

  • Essential indicators
  • Leadership indicators

Step 2 — Understand the Preloaded BRSR ESG Structure

SCT provides:

  • KPI definitions
  • Data types (qualitative/quantitative)
  • Disclosure dependencies
  • Calculation logic where relevant

Step 3 — Create BRSR Data Model

Using your ESG dictionary:

  • Map BRSR KPIs to SAP fields
  • Define custom KPIs if unique to your operations

Step 4 — Map Data Sources

For example:

BRSR IndicatorSAP Source System
EnergySAP PP/PM/MM
EmissionsSAP EHS / SAP Environment Management
WorkforceSAP HR / SuccessFactors
CSR SpendSAP Finance
Supplier DataSAP Ariba

Step 5 — Assign Data Owners

Plant-level → BU-level → Group-level
Setup workflows for approval and evidence uploads.

Step 6 — Set Validation Rules

Examples:

  • Mandatory fields
  • Thresholds
  • Year-over-year deviation alerts

Step 7 — Import Qualitative Data

Policies, governance, strategy, grievance redressal.

Step 8 — Run Consolidation Engine

SCT aggregates data across:

  • Plants
  • Business units
  • Countries
  • Reporting entities

Step 9 — Generate BRSR Report

Exports available:

  • PDF
  • Excel
  • MS Word
  • API for integration

B. CONFIGURATION STEPS FOR GRI IN SAP SCT

Step 1 — Activate GRI Framework

Framework Management → Add Framework → Choose “GRI 2021”

Step 2 — Select Material Topics

Based on:

  • Impact materiality
  • Financial materiality
  • Stakeholder expectations

Step 3 — Define “Disclosure Responsibility Matrix”

Map each GRI disclosure to:

  • System source
  • Process owner
  • Reviewer
  • Approver

Step 4 — Connect SAP & non-SAP Data

Examples:

GRI TopicMetricSource
302EnergySAP PP
305EmissionsSAP EHS
401EmploymentSAP HR
403SafetySAP EHS & Safety Suite

Step 5 — Configure Narrative Sections

SCT allows text blocks for:

  • Management approach
  • Eco-system impacts
  • Supply chain disclosures
  • Stakeholder engagement

Step 6 — Generate GRI Report

SCT creates a draft report with:

  • Coverage map
  • Missing disclosure log
  • Data lineage

C. CONFIGURATION STEPS FOR ISSB S1 & S2

ISSB requires deeper financial linkage.

Step 1 — Activate ISSB S1 & S2

Framework Management → Add Framework → Select ISSB

Step 2 — Map Financial Materiality KPIs

Examples:

ISSB RequirementSAP Source
Climate riskSAP PaPM / Finance
Emissions pathwaysSAP EHS
Industry KPIsSAP ERP
Value chain impactSAP Ariba

Step 3 — Set Up Climate Scenario Models

Upload data such as:

  • 1.5°C scenario
  • 2°C transition risks
  • Physical risk maps

Step 4 — Configure Impact Calculations

Using SAP Profitability & Performance Management (PaPM) when applicable.

Step 5 — Run Consolidation & Generate ISSB Report


D. GHG PROTOCOL CONFIGURATION IN SCT

Step 1 — Set Organizational Boundaries

  • Control approach
  • Equity share approach

Step 2 — Activity Data Integration

Scopewise:

Scope 1: fuels, refrigerants
Scope 2: electricity, district heating
Scope 3: logistics, procurement, employee commuting, capex

Step 3 — Emission Factor Mapping

Source emission factors from:

  • DEFRA
  • IPCC
  • GHG Protocol
  • Supplier-provided

Step 4 — Consolidation

Entity → Region → Group

Step 5 — Export Emissions Report


E. TCFD CONFIGURATION IN SCT

Step 1 — Governance Setup

Assign board/management roles.

Step 2 — Strategy Input

Upload climate transition plans, risk maps, policy exposure.

Step 3 — Risk & Opportunity Matrix

Define:

  • Physical risks
  • Transition risks
  • Time horizons

Step 4 — Metrics & Targets Mapping

Often sourced from GHG, finance, ERP.

Step 5 — TCFD Report Export


🌍 SECTION 4 — HOW COMPANIES USE SCT IN REAL ESG REPORTING CYCLES

While we avoid naming individual organizations, we can safely state:

Many large enterprises running SAP S/4HANA adopt SCT

Because ERP, EHS, HR, Ariba, SCM data already sits inside SAP.

Manufacturing firms use it for BRSR & GRI

Data comes from energy meters, waste registers, safety logs.

Conglomerates adopt SCT for ISSB

Because ISSB requires close linkage between sustainability and financial impacts.

Global companies use SCT for automation

Generated reports have audit trails, versioning, and workflow approvals.


🧭 SECTION 5 — END-TO-END SAP SCT IMPLEMENTATION TIMELINE

A typical 12–16 week roadmap:

Phase 0 (Week 1–2): Discovery

  • Reporting requirements
  • Framework selection
  • System landscape analysis

Phase 1 (Week 3–6): Configuration

  • Framework activation
  • KPI mapping
  • Data model design
  • Controls & validation setup

Phase 2 (Week 7–10): Integration

  • SAP ERP, EHS, HRMS, Ariba
  • Non-SAP connectors
  • Supplier data integration

Phase 3 (Week 11–14): Data Load + Testing

  • Historical data upload
  • Quality check
  • Auditor review

Phase 4 (Week 15–16): Reporting

  • BRSR
  • GRI
  • ISSB
  • GHG emissions
  • Board dashboards

🟢 SECTION 6 — BENEFITS OF USING SAP SCT FOR ESG REPORTING

Regulatory Compliance

BRSR, GRI, ISSB, GHG, TCFD supported by default.

Automated Data Collection

No spreadsheets, no email chaos.

Real-Time Dashboards

For plant, BU, and group-level insights.

Assurance Ready

Evidence, audit trails, role-based approvals.

✔ Finance Integration

Crucial for ISSB and climate financial risk reporting.

Repeatable, Scalable Reporting

Annual reports become faster and more accurate.


🌈 CONCLUSION — FROM CHAOS TO CLARITY

In the rapidly changing ESG landscape, companies cannot rely on manual reporting. They need:

  • A unified data model
  • Automated data flows
  • Integrated systems
  • Assurance-ready processes
  • Multi-framework reporting
  • Real-time dashboards

SAP Sustainability Control Tower (SCT) provides all of this—bringing order, structure, and confidence to ESG transformation.

BRSR ensures regulatory trust.
GRI ensures global comparability.
ISSB ensures investor credibility.

Together, they shape how the world sees your company.


🚀 Call to Action: Turn ESG Complexity Into Clarity

If your ESG reporting still feels like a maze of metrics, scattered spreadsheets, and last-minute compliance pressure — you’re not alone. Every company begins in chaos. What matters is the roadmap you choose next.

Whether you’re building BRSR for the first time, aligning with GRI, or preparing for ISSB’s finance-grade disclosures, the journey doesn’t have to be overwhelming. With the right architecture, the right processes, and the right tools — sustainability reporting becomes repeatable, audit-ready, and decision-driven.

If you want to:
✔ Design an ESG reporting blueprint
✔ Map metrics across BRSR/GRI/ISSB
✔ Implement or optimize SAP SCT
✔ Build an integrated data pipeline
✔ Make your sustainability data as reliable as your financials

Let’s talk.
Together, we can turn turbulent reporting demands into an opportunity for transformation, resilience, and leadership.

Your ESG clarity starts today.

Read more blogs on ESG here.

Here are two specific links to get you started:

  • SAP Help Portal: “Sustainability Control Tower” documentation — help.sap.com
  • SAP Community: SCT Implementation Tips & Updates — community.sap.com

The Implementation Crisis: Why ESG Strategy Dies in Execution

ESG Strategies Failure

ESG Failure: The Reality Behind Glossy Events

They unveiled it like a masterpiece. A glossy ESG report, polished to perfection — shimmering targets, elegant charts, bold claims: “Net-zero by 2040.” “50% renewables by 2030.” Investors nodded approvingly. Customers applauded the ambition. Employees felt proud to share it on LinkedIn.

But later that same afternoon, the real story surfaced.

In procurement, the cheapest supplier won — despite poor ESG compliance.
In R&D, sustainable product budgets were quietly cut.
In HR, diversity goals didn’t even make it to performance reviews.

The company that looked ESG-ready on paper wasn’t ESG-ready in practice.

This is the ESG Implementation Crisis.

And the numbers prove it.
McKinsey’s 2022 global study shows that while 87% of companies publish ESG commitments, only 34% integrate them into daily operations — and just 11% deliver measurable improvements. On average, it takes 4.7 years for companies to move from promise to real execution.

India faces the same gap. According to the 2023 CII–EY Survey:

  • 78% of companies have ESG policies,
  • but only 23% tie them to executive pay,
  • only 31% review ESG in quarterly business meetings,
  • and just 19% have met their interim targets.

The truth is undeniable:
ESG isn’t dying at the strategy table — it’s dying in execution.

Every CEO today knows how to announce ESG commitments.
Very few know how to execute them.

The real crisis in ESG isn’t lack of strategy.
It’s what happens after the strategy presentation ends and the business has to implement it.

Below is a clear, engaging breakdown of why ESG execution fails — with widely reported real-world examples from globally recognized companies.


1. Strategy–Execution Disconnect

When bold commitments never reach the shop floor.

Story: Starbucks & the Reusable Cup Problem

Starbucks made strong commitments to reduce waste and increase reusable cup adoption.
But stores lacked:

  • washing/cleaning infrastructure
  • operational workflows
  • staff training
  • queue-management processes
  • customer incentives

The result?
Reusable cup usage remained extremely low, and Starbucks had to repeatedly delay targets.

Lesson:
If operations teams can’t execute it, the strategy is just a press release.


Story: Large Energy Companies’ Net-Zero Plans Without Capex Shifts

Many oil & gas companies published net-zero commitments,
but continued allocating over 90% of capital expenditure to traditional fossil projects.
Because capital allocation didn’t change, emissions trajectories didn’t change either.

Lesson:
If budgets don’t reflect ESG goals, the strategy has already failed.


2. Resource Starvation

Where ideas are big, but budgets are tiny.

Story: Global Fashion Brands & Sustainable Collections

Many apparel giants introduced “sustainable collections” using eco-fabrics.
But suppliers reported:

  • no funding for traceability systems
  • no budget for cleaner dyes
  • no support for material transitions

Without financial backing, sustainability stayed a marketing initiative — not a supply chain transformation.

Lesson:
Sustainability without funding = greenwashing risk.


Story: Major Quick-Commerce Companies & Electric Delivery Fleets

Food and grocery delivery companies committed to shifting delivery fleets to electric vehicles.
But gig-workers reported:

  • no charging infrastructure
  • no battery replacement support
  • no EV lease incentives

The plan depended entirely on individuals bearing the cost.

Lesson:
ESG dies when execution depends on people who were never resourced for it.


3. The Accountability Vacuum

When ESG tasks exist, but no one truly owns the outcome.

Story: Large Banks & Responsible Lending Promises

Several global banks announced responsible lending frameworks,
but loan officers continued using legacy credit scoring,
because no one changed performance metrics or incentives.

So sustainability criteria never entered loan decisions.

Lesson:
If rewards don’t change, behaviors won’t change.


Story: Global Retailers & Labor Standards

Retailers published ethical sourcing standards,
but responsibility was split across:

  • sustainability teams
  • compliance teams
  • procurement
  • factory auditors
  • external certifiers

Because every team owned a “piece,”
no single leader owned the outcome.

Social audits improved on paper but not in practice.

Lesson:
Accountability must be single-point, not fragmentary.


4. Measurement Theater

When companies measure everything—except real impact.

Story: Food & Beverage Companies & “Recycle-Ready” Packaging

FMCG companies launched “100% recyclable packaging.”
But municipal recycling systems in many regions could NOT process these formats.
Technically recyclable ≠ actually recycled.

The company reported progress.
Customers saw no change in waste.

Lesson:
The wrong metric creates the wrong reality.


Story: Tech Platforms & Safety Metrics

Big tech platforms publish extensive sustainability and community-impact reports.
But safety and well-being issues persist because internal metrics emphasize engagement,
not user well-being.

Lesson:
When KPIs ignore real-world impact, ESG becomes a reporting exercise.


5. Cultural Resistance & Passive Non-Compliance

When the organization quietly refuses to change.

Story: Restaurant Chains & Waste Reduction Plans

Fast-food companies pledged to reduce packaging and food waste.
But many franchise owners resisted:

  • new waste sorting stages
  • compostable packaging
  • local sustainability rules
    because these added cost and slowed service speed.

The corporate commitment never survived frontline resistance.

Lesson:
Culture beats policy every single day.


Story: Manufacturing Firms & Safety Culture

Hundreds of manufacturers globally promote “zero harm” cultures,
but frontline employees report production pressure outweighing safety norms.
This leads to near-misses, unreported incidents, and compliance gaps.

Lesson:
Values do not matter if daily behavior contradicts them.


The Real Reason ESG Dies: Organizations Don’t Change Their Operating System

Every failed ESG strategy has one thing in common:

The company tried to change outcomes
without changing how decisions, budgets, incentives, and behaviors work.

Real ESG execution requires redesigning:

  • Capex decisions
  • Procurement rules
  • Leadership KPIs
  • Operational SOPs
  • Cultural norms
  • Measurement systems

ESG isn’t a policy.
It’s an operating model.


🚨 Call to Action: Before ESG Fails Your Business

ESG failures don’t destroy companies overnight.
They destroy them quietly — through stalled execution, misaligned incentives, reputational damage, and billions in stranded investments.

If your strategy isn’t embedded in operations, it isn’t a strategy. It’s a liability waiting to hit your balance sheet.

Now is the time to act. Not next quarter. Not after the next board meeting. Today.

Here’s what your leadership team must do immediately:

  1. Audit your ESG–execution gap
    Identify where ambition is not matched with budgets, incentives, data, or governance.
  2. Rewire how decisions get made
    ESG must shape capital allocation, procurement rules, product development, and risk appetite — not just reporting.
  3. Build accountability that bites
    Tie KPIs, bonuses, and operational targets directly to ESG outcomes.
    No accountability = no implementation.
  4. Equip your teams with resources to deliver
    Strategy without funding is not a strategy — it’s a public-relations risk.
  5. Fix culture before culture kills your ESG
    Train, incentivize, and align frontline managers.
    ESG fails when they quietly resist.

🔥 Act Now: Turn ESG from Reporting Burden into Competitive Advantage

Most companies treat ESG as compliance.
The winners treat it as operational strategy — and they are already pulling ahead in:

  • customer trust
  • access to capital
  • supply-chain resilience
  • regulatory readiness
  • talent retention
  • valuation multiples

Which side of history will your company be on?

👉 If your ESG strategy is stuck on PowerPoint, let’s turn it into execution.
Let’s build systems, not slogans.
Let’s operationalize ESG before the next disruption hits.


💼 Work With Us: ESG Execution That Actually Works

If your organisation is facing:

  • ambitious targets without roadmaps,
  • scattered ownership,
  • strained resources,
  • unclear KPIs,
  • or cultural resistance…

then you’re already in the “Implementation Crisis” zone.

You don’t need another report.
You need a partner who can translate ESG into budgets, SOPs, incentives, and real operational change.

📩 Reach out for a consultation on ESG execution, risk transformation, and sustainable strategy integration.
Let’s turn your turbulence into competitive advantage.

Read more blogs here.

🔍 Public References for ESG Implementation Failures

Example from BlogPublic Reference / Source
Starbucks – Reusable Cup Implementation IssuesCNBC: “Starbucks has a coffee-cup climate issue as mobile, drive-thru booms” — shows that despite reusable-cup goals, most sales still come in disposables. CNBC
Fortune: “Starbucks wants to eliminate disposable cups by 2030 — but only 1.2% of sales were in reusable ones in 2022.” Fortune
BP – Pullback on Green Investment / Shift Back to Fossil FuelsLivemint: “BP slashes ‘net zero’ renewable energy spending by $5 billion … turns to fossil fuels” mint
Economic Times: “BP walks back on renewable investment, to scale up fossil fuel production” The Economic Times
NetZeroInvestor: “BP to ramp up fossil fuel production and slash renewables” netzeroinvestor.net
Banks / Financial Institutions Funding Fossil Fuels Despite Net-Zero PledgesThe Guardian: “Banks still investing heavily in fossil fuels despite net zero pledges” The Guardian
NetZeroInvestor: “Banks ramp up fossil fuel funding in defiance of net zero pledges” netzeroinvestor.net

**ESG Isn’t Reporting — It’s Business Strategy

ESG Strategy

How ESG Strategy transforms business when integrated with Investment, Operations, Innovation & Risk**

For years, companies treated ESG like an annual chore — a report to file, a score to chase, a disclosure to polish.
But the companies winning today aren’t the ones with the thickest sustainability reports.

They’re the ones that realized something far bigger:

ESG isn’t reporting.
ESG is how modern businesses make decisions.

When ESG Strategy becomes part of capital allocation, supply chains, product design, and risk management, companies don’t become “more compliant.”
They become more competitive, more profitable, and more resilient.

Here are four stories that show how ESG reshapes the engines of business.


**Integrating ESG Strategy into Business & Operations

4 Stories That Prove ESG Is Strategic, Not Cosmetic**

**1) Capital Allocation

Ørsted’s £48 Billion Transformation**

In 2009, Ørsted faced a defining crossroads.
Its North Sea fossil fuel reserves were declining, and the financially “rational” choice — according to every traditional DCF model — was to invest $15–20 billion to squeeze out more oil and gas.

But the company did something revolutionary:
It integrated climate transition risk, carbon price scenarios, stranded asset exposure, customer preference shifts, technology learning curves, and green financing advantages directly into its investment decisions.

Suddenly, fossil fuels looked like the riskier bet.

Against market expectations, Ørsted divested fossil assets and invested £48 billion into offshore wind. The stock dropped 15%. Analysts mocked the decision.

Yet from 2009–2024:

  • Stock price ↑ 380%
  • ROIC on renewables: 12–14%
  • Avoided €8–12B in stranded asset write-downs
  • Market cap grew from $8B → $45B
  • Cost of capital ↓ 200 bps

This is what happens when ESG stops being a report and becomes part of capital allocation logic.


**2) Supply Chain

Interface’s Mission Zero**

In the mid-1990s, Interface — the world’s largest modular carpet company — uncovered a painful truth:
Their biggest environmental impact wasn’t in logistics or packaging. It was in materials, which accounted for 65% of their total footprint.

Instead of issuing stricter supplier guidelines, Interface reimagined the entire procurement model:

They collaborated instead of policing.

  • Shared engineering and sustainability expertise
  • Provided advance payments for new technologies
  • Offered long-term contracts to justify supplier investments
  • Built joint development partnerships

They invested in circularity.

Interface spent $50 million creating its ReEntry recycling program, allowing old carpets to be returned, broken down, and reused. By 2015, carpets contained 40% recycled content, which was cheaper and required 88% less energy than virgin materials.

The results were extraordinary:

  • Material costs ↓ 22%
  • Defect rates ↓ 35%
  • Supply disruptions ↓ 45%
  • Environmental footprint ↓ 65%
  • Revenue ↑ 40%

ESG in the supply chain isn’t about audits — it’s about designing economic and environmental resilience.


**3) Product Design & Innovation Integration with ESG

Tesla’s ESG-First Innovation Architecture**

Traditional automakers approached EVs as a regulatory checkbox.
Tesla approached EVs as a superior technology platform.

Instead of asking, “How do we meet emissions rules?” Tesla asked:
“How can sustainability unlock performance, efficiency, and new business models?”

That mindset changed everything.

Tesla’s ESG-driven innovation included:

  • Electric powertrains with supercar acceleration
  • A software-defined vehicle enabling OTA updates
  • Integration with home energy, solar, and storage
  • A charging ecosystem that made EV ownership seamless
  • R&D investment at 10–15% of revenue (vs. 3–5% at legacy OEMs)

The result?
Tesla became the most valuable automaker in the world — at one point valued more than the next 10 automakers combined, despite producing fewer vehicles.

Why?
Because its ESG-first design created a fundamentally better product.

Sustainability wasn’t a constraint. It was the catalyst.


**4) Risk Management Integration with ESG

PG&E’s $30 Billion Collapse**

If Ørsted shows the upside of ESG integration, PG&E shows the catastrophic downside of ignoring it.

Operating in wildfire-prone California, PG&E had years of data showing increasing climate risk.
But climate remained stuck in sustainability reports, not in the core risk management system.

ESG risk lived in silos:

  • Climate analysis existed only in the sustainability team
  • The Board’s risk committee relied on historical data, not forward climate projections
  • Capital spending favored reliability metrics, not resilience
  • Safety culture focused on minor OSHA violations instead of catastrophic system failures

On November 8, 2018, a nearly 100-year-old transmission line sparked the Camp Fire.

The consequences:

  • 85 fatalities
  • A town destroyed
  • $30 billion in financial liability
  • 85% stock value wiped out
  • Bankruptcy
  • Criminal prosecution

All because ESG risk never influenced strategic decisions, investments, or asset replacement priorities.

ESG isn’t reporting — it’s risk prevention.


The Real Message for Leaders

These four stories point to one truth:

ESG isn’t a communications exercise.
It is a business model choice.

Companies that integrate ESG into their strategy and operations outperform because they:

  • Invest better
  • Innovate faster
  • Build stronger supply chains
  • Avoid catastrophic risks
  • Win customer trust
  • Attract cheaper capital

ESG doesn’t create moral advantage.
It creates competitive advantage.


Take the Lead: Turn ESG Into Your Business Advantage

Ørsted transformed its future by reallocating capital.
Interface rebuilt its supply chain into a competitive moat.
Tesla used ESG to unlock world-changing innovation.
PG&E showed the deadly cost of ignoring ESG risk.

Your business now faces the same crossroads.
The question isn’t “Should we do ESG?”
It’s “Will we integrate ESG deeply enough to stay competitive?”

If you’re ready to:
✅ Rewire capital allocation for long-term value
✅ Build resilient, future-ready supply chains
✅ Turn sustainability into product innovation
✅ Strengthen risk management before disruptions strike

Then it’s time to act.

→ Let’s build your ESG Integration Roadmap.

Whether you need a full strategy redesign, a specific transformation program, or board-level advisory, we help you turn ESG from a compliance burden into a growth engine and resilience shield.

→ Connect with us to start your ESG transformation.

Your next competitive leap could start with one conversation.

Here are some reference links for the four corporate ESG-integration stories mentioned in the blog:

StoryReference
Ørsted – Capital Allocation / TransformationIMD case study: “Ørsted: On the path to net zero” IMD
Ørsted’s own white paper on its green transformation Ørsted
Interface – Supply Chain / Mission ZeroGuardian article: “Interface is a carpet-tile revolutionary” The Guardian
RSM (Rotterdam) SDG case: “Interface: Creating a Climate Fit for Life through Carpet Tiles” RSM
UNFCCC summary: “From Mission Zero to Climate Take Back” UNFCCC
PG&E – Risk Management / Wildfire RiskSustainalytics ESG research blog: “Risk Exposure in a Changing Climate: The Story of PG&E” sustainalytics.com
Columbia Law School climate risk report: “Climate Risk in the Electricity Sector” Sabin Center for Climate Change Law

Read more blogs on ESG here.

ESG Stories of Turbulence, Turnaround & Outcome – 10 Inspiring Real World Examples

Indian ESG Stories

ESG Stories

How India’s Largest Companies Turn ESG Chaos Into Competitive Power.

If you think ESG is just reporting checklists, think again. For India’s corporate giants, ESG has become a battlefield—where reputation can crumble in a day, but trust, value and resilience are rebuilt over years. These stories of turbulence and turnaround prove one truth:

ESG is not about compliance. ESG is about survival. And transformation.

Below are India’s most compelling journeys—companies that stumbled, struggled, and then used ESG to rise stronger than before.


1. ITC — From Tobacco Anxiety to Sustainability Leadership

There was a time when ITC was defined by one uncomfortable reality: its core business was tobacco. Investors were skeptical. Social perception was negative. Global ESG ratings consistently flagged the company.

But over the last decade, ITC proved what a purpose-driven pivot looks like.

The Turbulence

  • Accused of being “over-dependent on cigarettes.”
  • Investors questioning long-term value.
  • Limited recognition for its massive agri & sustainability initiatives.

The Turnaround

ITC built a multi-decade ESG transformation that silently changed everything:

  • 100% solid waste recycling in multiple factories.
  • India’s first major FMCG with plastic-neutral status.
  • Watershed development covering millions of acres.
  • Renewable energy powering manufacturing clusters.

Their ESG roadmap created a new identity:

“From a tobacco company to India’s most sustainable conglomerate.”

Outcome

  • Stronger global investor profile.
  • Higher resilience due to diversified green businesses.
  • Surpassed peers in ESG scores & sustainability indices.

2. Vedanta — From Crisis Headlines to Responsible Mining

No company in India has faced ESG turbulence like Vedanta.

The Turbulence

  • Protests related to the Tuticorin plant.
  • Environmental and community criticisms.
  • Intense media scrutiny and investor concern.

For some companies, such pressure destroys morale.
For Vedanta, it became a mirror—and a catalyst.

The Turnaround

Vedanta rebuilt its ESG foundation:

  • Net-zero commitment by 2050 (Scope 1 & 2).
  • One of India’s largest ESG-linked financing programs.
  • Robust community welfare, women empowerment, health & livelihood initiatives.
  • Tailings dam safety upgrades aligned with global best practices.

Outcome

  • Re-entry into global investment portfolios.
  • Continuous upgrade in ESG ratings.
  • Strengthened social license to operate.

Vedanta’s story shows:

ESG doesn’t erase history. ESG rewrites the future.


3. Tata Steel — The Benchmark for Responsible Steelmaking

Tata Steel is the classic case study in ESG excellence.

The Turbulence

  • Global steel volatility.
  • Heavy emissions footprint.
  • High expectations as India’s most iconic industrial brand.

The Turnaround

While others debated carbon cost, Tata Steel moved with bold intent:

  • Hydrogen-based steel pilots.
  • Circular economy: recycling scrap into high-grade steel.
  • Top global safety standards.
  • Industry-leading community development in Jamshedpur & Kalinganagar.

Outcome

  • Consistently in the Global Top 10 for steel ESG rankings.
  • Preferred by global supply chains with net-zero commitments.
  • Massive operational efficiency gains through energy transition.

Tata Steel demonstrates:

ESG leadership is not charity—it’s competitive advantage.


4. Hindustan Unilever (HUL) — When Purpose Became a Profit Engine

If any Indian corporate made ESG mainstream, it’s HUL.

The Turbulence

  • Packaging waste criticism.
  • High water usage for FMCG manufacturing.
  • Pressure to shift to circularity.

The Turnaround

HUL built a fully integrated sustainability model:

  • Plastic take-back & recycling at national scale.
  • Water-positive factories in multiple locations.
  • Inclusive sourcing and rural empowerment through Shakti Ammas.
  • Aggressive Scope 1 & 2 decarbonization roadmap.

Outcome

  • Massive brand trust uplift.
  • Lead position in global ESG benchmarks.
  • Growth driven by sustainable products.

HUL proves:

Consumers reward brands that protect both people & the planet.


5. Mahindra Group — India’s Climate Leadership Pioneer

Mahindra didn’t wait for global pressure—they moved early.

The Turbulence

  • Auto sector emissions scrutiny.
  • Investor pressure post global EV disruptions.
  • Need to transform a 70-year-old brand.

The Turnaround

Mahindra executed India’s first true climate leadership model:

  • First Indian company with a science-based target (SBTi).
  • Early investment in electric mobility (Mahindra Electric).
  • Carbon pricing at internal corporate level (₹1,500 per ton).
  • Large-scale renewable energy adoption.

Outcome

  • Attracted sustainability-linked loans.
  • Became a favorite for ESG funds.
  • Reinforced reputation as India’s most future-ready conglomerate.

This is what vision before compulsion looks like.


6. Bharat Forge — The Green Reinvention of a Heavy Engineering Giant

Bharat Forge faced a classic challenge:
“How does a heavy engineering company become ESG-positive?”

The Turbulence

  • Steel-intensive, carbon-heavy processes.
  • High energy consumption.
  • Global OEMs pushing for green supply chains.

The Turnaround

Bharat Forge redesigned its identity:

  • Shift to electric vehicle components (axles, chassis, lightweight systems).
  • Investment in renewable energy across plants.
  • Focus on green forging technologies that reduce energy use.
  • Strong governance & transparency improvements.

Outcome

  • Preferred supplier for global EV OEMs.
  • Higher operational efficiency with lower carbon cost.
  • Strong ESG visibility with investors.

Bharat Forge shows how traditional industries can leapfrog into clean tech.


7. L&T — From Compliance to Value Creation

L&T’s ESG acceleration is a masterclass.

The Turbulence

  • Massive construction footprint.
  • Energy & emissions heavy EPC projects.
  • Complex supply chain & contractor ecosystem.

The Turnaround

L&T embraced ESG across the value chain:

  • Green buildings & clean energy infra across India.
  • Renewable EPC leadership.
  • Strong BRSR & integrated reporting practices.
  • Large investment in skilling, safety & worker welfare.

Outcome

  • Among the top infrastructure companies in global ESG rankings.
  • Strong ability to win climate-resilient projects worldwide.
  • Re-rating by long-term ESG investors.

8. Infosys — When Carbon Neutral Became a Culture

Infosys is one of India’s earliest ESG champions.

The Turbulence

  • Rising carbon footprint from global operations.
  • High energy consumption due to data centers & campuses.
  • Investor push for transparency in supply chain.

The Turnaround

Infosys executed one of the most respected ESG transitions:

  • Carbon neutral since 2020.
  • One of the world’s most energy-efficient campuses.
  • Shift to 100% renewables.
  • Deep digital skilling for communities.

Outcome

  • Global admiration as an ESG-first IT company.
  • Consistently high ESG scores.
  • Competitive advantage in green digital transformation projects.

Infosys didn’t follow ESG—it shaped ESG.


9. JSW Steel — Turning a Carbon-Heavy Sector Into a Green Watchpoint

JSW Steel is proof that even the hardest-to-abate sectors can rewrite their story.

The Turbulence

  • Steel production labelled as high-carbon.
  • Investor & NGO scrutiny.
  • Pressure from global buyers demanding green steel.

The Turnaround

JSW accelerated a clean transition:

  • Massive renewable energy integration.
  • Carbon capture pilot projects.
  • Waste-heat recovery systems across plants.
  • Social programs for education, skill-building & health.

Outcome

  • Improved ESG ratings across CRISIL, MSCI, Sustainalytics.
  • Strong acceptance in international green supply chains.
  • Operational cost savings and brand uplift.

10. HDFC Bank — Governance, Trust & Community Leadership

In banking, ESG is all about trust.

The Turbulence

  • Regulatory scrutiny at various points.
  • Need to build stronger disclosures.
  • Climate-risk expectations from global investors.

The Turnaround

HDFC Bank expanded its ESG impact:

  • One of India’s largest CSR footprints.
  • Rural empowerment & microfinance access.
  • Strong focus on governance, transparency & risk culture.
  • Sustainable finance frameworks for green loans & bonds.

Outcome

  • Among the most trusted banking ESG profiles in Asia.
  • Positive global investor sentiment.
  • Strong alignment with RBI’s emerging climate guidelines.

🌱 The Invisible Thread Behind Every Turnaround: The ESG Roadmap

Across ITC, Vedanta, Tata Steel, HUL, Mahindra, L&T, Infosys, JSW Steel & HDFC Bank—one theme appears again and again:

ESG roadmaps aren’t documents. They are decisions.
Not reporting frameworks, but transformation frameworks.

A consistent pattern repeats:

  1. Phase 1 – Foundation: Materiality, baseline, governance.
  2. Phase 2 – Data & Technology: Systems, automation, real-time metrics.
  3. Phase 3 – Strategy: Targets, pathway, business alignment.
  4. Phase 4 – Reporting & Assurance: BRSR, GRI, ISSB, third-party checks.
  5. Phase 5 – Continuous Improvement: Innovation, green finance, future-proofing.

Every company above followed these steps—some slowly, some aggressively—but all emerged stronger.


💡 The Real Lesson: ESG Is Not a Cost. ESG Is a Catalyst.

These stories teach us:

  • ESG protects companies during crises.
  • ESG attracts global capital—ESG-linked bonds, sustainability loans, green investors.
  • ESG builds brand trust.
  • ESG drives operational savings & innovation.
  • ESG secures long-term competitiveness.

India’s corporate transformation is not happening on spreadsheets.
It’s happening in boardrooms, factories, fields, communities, and supply chains—every day.


🔥 Final Thought

If these giants can change their trajectory with ESG, so can any company—big or small.

ESG is no longer about being good. It is about staying relevant.
It is about resilience.
It is about leadership.


🗣Call to Action

Transform Turbulence Into Opportunity

Every organisation faces turbulence — only a few turn it into competitive advantage.
If you’re ready to turn ESG risks into growth and resilience, we’re here to guide you.
👉 Contact us today to begin your sustainability transformation.

Read more blogs on sustainability here.

Some references –

Tata Steel ESG Indicators & Net-Zero Goals — Tata Steel Annual Report ESG Goals tatasteel.com

**The Definitive ESG Roadmap for Indian Companies

ESG Roadmap

BRSR, BRSR Core & Global Alignment**


ESG Roadmap Options for Indian Companies

In 2025, ESG is no longer about “sustainability reporting.”
It is about access to cheaper capital, stronger supply chains, and long-term resilience.

Here’s the opportunity:

👉 Companies with strong ESG data qualify faster for ESG-linked loans at lower interest rates
👉 BRSR Core–ready organisations earn investor trust and attract ESG-linked bonds
👉 Transparent governance accelerates global customer approvals
👉 Integrated ESG systems reduce operational costs by 5–12%
👉 High-quality disclosures boost brand credibility and market valuation

India’s corporate ESG landscape is transforming rapidly. With SEBI mandating BRSR, phasing in BRSR Core assurance, and global investors demanding ISSB/TCFD/GRI alignment, the question for companies is no longer “Should we do ESG?” but:

“Which roadmap should we follow — Minimal, Mid-Level, or Full ESG Transformation?”

This blog begins with the three ESG roadmaps for Indian companies, followed by a complete deep-dive into implementation guidelines, frameworks, timelines, challenges, and best practices.

Companies in India fall into three maturity categories. Depending on your current capabilities and urgency, you can pick one of three transformation paths.

ESG Roadmap -  Options

ROADMAP A: Minimal Compliance (6–9 Months)

For companies focused only on meeting SEBI’s minimum BRSR requirement

Objectives:

  • Avoid regulatory non-compliance
  • Implement basic ESG data collection
  • Prepare for eventual BRSR Core requirements without full investment yet

Key Focus Areas:

  • Basic BRSR disclosures (narrative + quantitative)
  • Assign ESG data owners per metric
  • Create simple monthly ESG MIS
  • Identify gaps for BRSR Core, ISSB, TCFD (future needs)

Deliverables:

  • BRSR report
  • High-level sustainability policy
  • ESG governance structure
  • Initial materiality assessment

Who chooses this?
Small/mid-sized companies or large companies just starting ESG capability-building.


ROADMAP B: Mid-Level ESG Implementation (12–18 Months)

For companies ready to go beyond compliance & build assurance-grade systems

Objectives:

  • BRSR + BRSR Core readiness
  • Internal controls that auditors can validate
  • Partial future-proofing for ISSB/TCFD
  • Strengthen supplier value chain data

Key Focus Areas:

  • Internal ESG control framework (evidence trails, monthly reconciliations)
  • Audit-ready BRSR Core KPI processes
  • Supplier ESG scorecard implementation
  • Climate baseline (Scope 1,2, and starting 3)

Deliverables:

  • BRSR (comprehensive)
  • BRSR Core KPI readiness (49 metrics)
  • ESG data platform / SSOT
  • Limited assurance preparation

Who chooses this?
Companies preparing to meet investor expectations & regulatory assurance requirements in FY 2025–27.


ROADMAP C: Full ESG Transformation (18–36 Months)

For companies aiming to reach global standards and integrate ESG into business strategy

Objectives:

  • Full BRSR + assured BRSR Core
  • Global frameworks alignment (ISSB S1/S2, GRI, TCFD)
  • Integrate ESG into enterprise risk management & financial reporting
  • Climate strategy, SBTi targets, and digital ESG systems
  • Enterprise-wide sustainability culture

Key Focus Areas:

  • ESG strategy linked to business growth
  • Decarbonization pathways
  • Scope 1–3 value chain emissions
  • AI/IoT-powered environmental data
  • Integrated reporting
  • Supplier decarbonization plans

Deliverables:

  • ISSB-compliant sustainability disclosures
  • TCFD-aligned climate risk reporting
  • GRI-based Sustainability Report
  • Full BRSR Core assurance
  • ESG-linked remuneration
  • Industry-leading sustainability performance

Who chooses this?
Large conglomerates, high-visibility brands, exporters, global-capital-dependent companies.


The ESG Transformation Journey for Indian Companies

After choosing the roadmap, companies must understand the detailed phases of implementation.

PHASE 1 — Foundation (3–6 Months)

Building the governance, policies & scope of ESG transformation

The Foundation phase establishes the organisational base required for an effective ESG journey. Companies begin by setting up governance structures such as an ESG Committee, defining roles, responsibilities, and cross-functional ownership. This is followed by conducting a double materiality assessment to identify ESG topics that matter most to both the business and its stakeholders. A detailed gap assessment highlights compliance requirements under frameworks like BRSR, GRI, SASB, and ISSB. In this phase, organisations also create core sustainability policies—covering areas such as human rights, diversity, ethics, safety, and supplier responsibility. By the end, the company has clarity on priorities, risks, and its ESG vision, which sets the stage for data and strategy work in the subsequent phases.

Key Activities

  1. Board-Level ESG Mandate
    • Create a Sustainability Committee or embed ESG into Audit/Risk Committees.
    • Define oversight responsibilities.
  2. ESG Steering Committee
    • Leadership from Finance, HR, EHS, Supply Chain, CSR, IT, Operations, Legal.
  3. Materiality Assessment
    • Double materiality approach (impact + financial).
    • Stakeholder interviews/surveys (employees, investors, regulators, customers, communities).
  4. Gap Assessment
    • Assess current data maturity vs:
      • BRSR (mandatory)
      • BRSR Core (assured KPIs)
      • ISSB
      • TCFD
      • GRI
  5. ESG Roadmap Definition
    • Quick wins
    • Year 1 compliance
    • Year 2 assurance
    • Year 3 global alignment

PHASE 2 — Data & Technology (6–12 Months)

Fixing data fragmentation — the biggest challenge for Indian companies

Common Problems in Indian Companies

  • Information scattered across Excel, SAP, emails, PDFs
  • No owner per KPI
  • Non-standard units & inconsistent measurement
  • No audit evidence trail
  • Vendor/supplier data missing

Solutions

1. Assign ESG Data Owners per KPI

Examples:

  • GHG → EHS & Facilities
  • Health & Safety → HR + EHS
  • Community → CSR
  • Governance → Company Secretary
  • Value Chain ESG → Procurement
  • Compliance → Legal
  • Controls, audit trail → Finance

2. Single Source of Truth (SSOT) Setup

  • ESG platforms integrating SAP/S4HANA, HRMS, Energy Meters, Vendor Portals
  • Master Data Management (MDM)
  • Version-controlled evidence documents

3. Monthly Data Reconciliation

Proven best practice:

  • Bharat Forge reduced ESG data variance from 18% → <2% with monthly reconciliation.

4. ESG Evidence Repository

For every KPI, store:

  • Meters logs
  • Bills & invoices
  • Weight slips
  • Emission factor references
  • Compliance certificates

5. Control Framework

Mandatory for BRSR Core assurance:

  • Maker-checker
  • Review logs
  • Document retention policy
  • Internal audit sampling

In this phase, companies build the digital and data backbone that ESG requires. The process begins with mapping all ESG-relevant data sources—such as ERP systems, HRMS, supply chain tools, and operational logs—and identifying gaps, data owners, and controls. Standardised KPIs are designed in alignment with major reporting frameworks, enabling consistent measurement. Technology tools like SAP Sustainability Control Tower, Microsoft Sustainability Manager, or Enablon are implemented to automate data capture, ensure accuracy, and create real-time dashboards. This phase transforms ESG measurement from manual and spreadsheet-driven to an intelligent, scalable system that is audit-ready and capable of supporting investor-grade reporting.


PHASE 3 — ESG Strategy (3–6 Months)

Turning compliance into business strategy

Once data stabilizes, the company develops forward-looking targets.

ESG Strategy must come after the Data & Technology phase because strategy needs real numbers, not assumptions. For example, a company may believe its biggest issue is electricity use and set a target to cut energy by 30%. But once Phase 2 data is digitised and reconciled, it may discover that 75% of emissions actually come from suppliers (Scope 3), not its own plants. This completely changes the strategy—from energy projects to supplier engagement, low-carbon materials, and logistics optimisation. Without accurate data first, the company would set the wrong targets and fail audits later.

Strategic Components

1. Climate Strategy

  • Scope 1–2–3 emissions baseline
  • SBTi-aligned targets
  • Renewable energy roadmap
  • TCFD scenario modelling:
    • Carbon tax risks
    • Physical climate hazards
    • Transition risk pathways

2. Social Strategy

  • Workforce diversity
  • Upskilling plans
  • Worker wellbeing initiatives
  • Community impact plan

3. Governance Enhancements

  • Whistleblower processes
  • Board independence & ESG skills
  • Anti-corruption controls
  • CEO/CXO scorecards linked to ESG

4. Supplier ESG Program

  • Map top 100 suppliers
  • Tiering approach: High-risk → deeper assessments
  • Supplier code of conduct
  • ESG compliance scorecard
  • Value chain data model (needed for BRSR Core)

The ESG Strategy phase translates data insights and material topics into a structured strategic plan. Companies set measurable targets such as net-zero commitments, energy transition pathways, water positivity, waste reduction, or diversity goals. Scenario analysis, often aligned to TCFD, helps identify climate risks and business impacts. Based on this, organisations create a 3–5 year ESG roadmap outlining initiatives across operations, supply chains, products, and communities. Financial planning is a critical component—evaluating capex, ROI, cost savings, and ESG-linked financing options. This phase ensures ESG moves beyond compliance and becomes a driver of competitive advantage, efficiency, and long-term value creation.


PHASE 4 — Reporting & Assurance (6–12 Months)

The most demanding phase: public disclosures, audits & controls

1. BRSR (Comprehensive)

  • Hundreds of metrics
  • Qualitative + quantitative disclosures
  • Governance + policies + value chain inputs

2. BRSR Core (49 KPIs)

These are the most material, high-impact, audit-focused metrics across:

  • Emissions
  • Water use
  • Energy efficiency
  • Workforce wellbeing
  • Supply chain standards
  • Responsible sourcing
  • Governance integrity

Assurance Timeline (SEBI Mandate)

  • FY 2023–24 → Top 150
  • FY 2024–25 → Top 250
  • FY 2025–26 → Top 500
  • FY 2026–27 → Top 1000

3. Internal Controls & Audit Readiness

  • Documented SOPs
  • Control testing
  • Quarterly internal audits
  • Management assertions
  • Evidence trail for each KPI

4. Global Framework Alignment

  • ISSB S1/S2 for investor-grade reporting
  • TCFD for climate governance & risk
  • GRI for stakeholder impact

This phase focuses on converting ESG performance into transparent, credible, and compliant disclosures. Companies prepare sustainability reports aligned to BRSR, BRSR Core, GRI, SASB, or ISSB standards. Reporting requires robust internal validation, reconciliation with financial data, and clear narrative building around achievements and challenges. Independent assurance partners—such as Big 4 firms—verify emissions data, controls, and processes to ensure reliability and investor trust. Strong assurance not only reduces risks of greenwashing but also enhances the organisation’s ESG ratings, access to global markets, and stakeholder confidence.


PHASE 5 — Continuous Improvement (Year 2–3 Onwards)

ESG becomes an operating system, not a report

Leading Indian companies evolve into “ESG-centric enterprises”.

Key Advancements

  • Integrate ESG with ERM
  • ESG-linked bonuses for CEO/CXOs
  • AI-driven Scope 3 calculations
  • Industry benchmarking dashboards
  • Supplier transition programs
  • Integrated Reporting (IR)

The Continuous Improvement phase shifts ESG from a project to a long-term performance engine. Companies benchmark against peers, track year-on-year progress, and integrate ESG into business functions such as procurement, risk management, product design, and leadership KPIs. Innovation becomes central—driving circular economy projects, low-carbon technologies, supplier partnerships, and climate resilience strategies. ESG audits, periodic reassessments, and updated targets ensure momentum and accountability. Over time, ESG becomes deeply embedded in culture and operations, strengthening competitiveness, brand value, and long-term sustainability outcomes.


Integrating BRSR/BRSR Core with Global Frameworks

As India moves toward a more transparent, accountable sustainability regime, BRSR and BRSR Core have become mandatory foundations. But for companies operating in global supply chains, seeking international capital, or aiming to meet investor expectations, these Indian requirements alone are not enough. Integrating them with global frameworks—GRI, SASB, ISSB, TCFD, CDP—is now essential for both compliance and competitiveness.

PurposeFrameworkWhy it matters
Indian regulatory complianceBRSR + BRSR CoreMandatory for top 1000; assurance critical
Global investor accessISSB S1/S2Finance-grade disclosures
Climate risk governanceTCFDRequired in global markets
Stakeholder transparencyGRI StandardsImpact-oriented reporting
Integrated ReportingIR FrameworkValue creation approach

Best practice:
Use BRSR for India, ISSB for investors, GRI for stakeholders, and TCFD for climate risk.


Indian ESG Challenges & How to Solve Them

1. Fragmented Data

Fix: Integrated ESG platform + clear data owners + standard formats.

2. No Audit Trail

Fix: Monthly reconciliations, evidence repository, control logs.

3. Supplier Data Gaps

Fix: Supplier code of conduct, ESG scorecards, value-chain KPIs.

4. Complex Metrics

Especially in GHG Scope 3.
Fix: Start with 5 major categories → expand gradually.

5. Board Awareness Gaps

Fix: Board training, ESG risk dashboards, committee oversight.

6. Limited Resources

Fix: Create 200–500 “ESG Champions” across plants & functions.


What Indian Boardrooms Must Ask

Governance

  • Who owns ESG? Is accountability clear?

Data Integrity

  • Are ESG metrics audit-ready?
  • Are controls equivalent to financial reporting?

Risk

  • What climate, regulatory, and supply chain risks do we face?

Competitiveness

  • Are we ahead or behind peers?
  • What is the ROI of ESG initiatives?

Future Readiness

  • How prepared are we for ISSB?
  • Is our value chain decarbonization plan realistic?

ESG Is Now a Business Competitiveness Imperative

Indian companies are now expected to meet domestic compliance (BRSR), audited KPIs (BRSR Core) and global investor expectations (ISSB, GRI, TCFD).

The companies who adopt Roadmap C will lead markets.
Those who settle for Roadmap A risk being left behind as ESG becomes the next frontier of competitiveness.

Your ESG journey is not just about reporting.
It is about building a future-proof business model that attracts capital, talent, customers, and long-term growth.


Call to Action: Your ESG Transformation Starts Today

ESG is no longer a reporting exercise — it’s a competitive advantage.
Whether your organisation chooses Minimal Compliance, Mid-Level ESG, or a Full Transformation, the real differentiator is starting early and building the right systems.

If your leadership team is asking:

  • “Where do we begin with BRSR and BRSR Core?”
  • “Which roadmap suits our company’s scale and maturity?”
  • “How do we reduce compliance risk and move toward real value creation?”
  • “How do we design ESG data architecture that actually works?”

Then it’s time to act — not wait.

👉 Book an ESG Roadmap Consultation

Get a customised, phase-wise ESG implementation blueprint tailored for your industry, size, and SEBI expectations.

👉 Request a BRSR/BRSR Core Readiness Assessment

Identify gaps, high-risk areas, and priority KPIs before the next reporting cycle.

👉 Download the ESG Roadmap Template

A practical, board-ready guide to help your leadership teams make informed decisions.


ESG will reshape Indian business in the next three years.
The question is — will your company lead the change or be forced to catch up?

Let’s build your transformation story.
Start today.

Read more blogs on sustainability here.

Reference SEBI Circular March 2025.

🌍 **The Untold Story of ESG Evolution

ESG Evolution

How SBTi, TCFD, GRI, SASB & ISSB Evolved From Chaos to Clarity**

If ESG frameworks were characters in a movie, this would be the blockbuster:
full of disasters, revolutions, heroes, conflicts, mergers, and defining moments.

This is the real story of how SBTi, TCFD, GRI, SASB, CDP, ISSB, BRSR & CSRD came to life — not as boring standards, but as the world’s desperate attempt to fix a broken system.

Grab a coffee.
You’re entering the ESG multiverse.


🌑 CHAPTER 1 — Before ESG: The World That Looked Away (1960s–1990s)

There was a time when companies only cared about two things:
profits and quarterly results.

No one asked:

  • How much waste do you dump?
  • How unsafe are your factories?
  • How toxic is your supply chain?

It was a world where growth was worshipped and consequences ignored.

Then the world started sending warnings — slowly, painfully.

Rivers changed color.
Cities drowned in smog.
Workers died in preventable accidents.

But the biggest wake-up call was yet to come.


🌊 CHAPTER 2 — 1989: The ESG Evolution

The year was 1989.
The Alaskan sea was calm, quiet.

Then the tanker Exxon Valdez hit a reef.

In hours, 11 million gallons of oil darkened the ocean.
Birds suffocated.
Communities choked.
An entire ecosystem collapsed.

The world watched in horror.

And for the first time, people asked:

“Why don’t companies report the damage they cause?”

Silence.
No standards.
No sustainability reporting.
Nothing.

This tragedy planted the seeds of ESG reporting.


🌱 CHAPTER 3 — 1997: The Birth of GRI, The First Framework of Hope

A small team in Boston, backed by the UN and environmental groups, had a wild idea:

“What if companies publicly report their environmental and social impact?”

It felt impossible.
Corporations would never agree.
No one had ever done it.

But they tried anyway.

In 1997, they launched:

🌍 GRI — Global Reporting Initiative

The world’s first real ESG standard.

It introduced bold ideas:

  • Report your emissions
  • Report your waste
  • Report how you treat workers
  • Report your governance
  • Report your social impact

GRI became the first global language of sustainability.

For the first time…
the world saw what companies were hiding.


🔥 CHAPTER 4 — 2000: CDP Sparks a Transparency Revolution

The early 2000s brought another shift.

Climate change suddenly became an investor concern.
Pension funds, banks, and insurers asked:

“If climate risks affect business, how do we know which companies are exposed?”

There was no data.

So in 2000, CDP sent a simple questionnaire asking companies:

“How much carbon do you emit?”

No rules.
No obligations.

Yet companies responded.

CDP’s annual scores (A to D-) became a global pressure system.
Boards cared.
Investors cared.
Media cared.

This was the moment ESG became competitive.

CDP = Carbon Disclosure Project
A global environmental disclosure system where companies report climate, water, and forests impact.


🏦 CHAPTER 5 — 2011: SASB — Wall Street Wants Its Own ESG Language

Even after GRI and CDP, investors weren’t satisfied.

They said:

“Not all ESG issues matter financially.
Give us only what impacts valuation.”

So in 2011, SASB was born.

It wasn’t built by activists.
It was built by analysts.

SASB introduced:

  • Financial materiality
  • Industry-specific standards (77 industries)
  • ESG KPIs linked directly to business performance

Airlines had different KPIs than banks.
Tech had different KPIs than mining.

SASB gave ESG a Wall Street dictionary.

Now ESG wasn’t just about impact — it was about value.

SASB = Sustainability Accounting Standards Board
Industry-specific sustainability disclosure standards focused on financially material ESG issues.
(Now consolidated into ISSB)


🌡️ CHAPTER 6 — 2015–2017: TCFD — Climate Walks Into the Boardroom

Then came a dramatic twist. The story of TCFD doesn’t begin in sustainability.
It begins in fear — the fear that climate change could crash the financial system just like the 2008 economic meltdown.

In 2015, the Financial Stability Board (FSB) — the global guardian of financial stability — created a task force.

Not a sustainability group.
Not an environmental body.
But a finance-driven task force.

Its mission was bold:

“Tell us how climate change can destabilize the global economy — and how companies should report it.”

Thus, the Task Force on Climate-related Financial Disclosures (TCFD) was born..

This wasn’t another sustainability report.
This was risk management.

TCFD introduced four simple but revolutionary pillars:

1️⃣ Governance – Who is responsible for climate oversight?
2️⃣ Strategy – How will climate impact the business model?
3️⃣ Risk Management – What climate risks could harm the company?
4️⃣ Metrics & Targets – How are you measuring progress?

For the first time, climate risk entered the boardroom.

TCFD released its landmark recommendations — simple, principle-based, and designed for global use.

Companies were encouraged to disclose:
✔ Physical risks (storms, floods, heatwaves)
✔ Transition risks (policies, shifting markets, carbon pricing)
✔ Opportunities (energy savings, new markets)
✔ Forward-looking scenarios (what happens if the world warms by 2°C or 4°C?)

For investors, this was a breakthrough.
For companies, a wake-up call.

This pushed climate into the C-suite.

Boards could no longer ignore climate.

Slow Start… Then a Surge (2018–2020)

At first, adoption was slow.
Companies said: “This seems too complicated.”

But as climate disasters surged globally — wildfires, floods, extreme heat — investors got louder:

💼 “We cannot price climate risk if companies don’t disclose it.”

BlackRock, State Street, banks, insurers, stock exchanges — all began endorsing TCFD.

By 2020, TCFD had become the gold standard for climate disclosure.

Regulations Arrive (2021–2022)

Countries started adopting TCFD into law.

🌏 UK — first to mandate TCFD reporting
🇯🇵 Japan — mass adoption across financial institutions
🇳🇿 New Zealand — mandatory for large companies
🇨🇦 Canada — mandatory for banks and insurers
🇸🇬 Singapore — stock exchange requires TCFD-aligned reporting

TCFD had moved from “nice to have” to “mandatory compliance.”


🌍 CHAPTER 7 — 2015–2020: SBTi & the Rise of Net-Zero Commitments

But something was still missing.

Transparency is good.
But transparency without action is hollow.

So four organizations joined forces:

  • WWF
  • CDP
  • WRI
  • UN Global Compact

They launched:

🌱 SBTi — Science Based Targets initiative

This was not disclosure.
This was action.

SBTi forced companies to:

  • Calculate full emissions (Scope 1, 2, 3)
  • Align targets to 1.5°C
  • Set net-zero pathways
  • Get validation from climate scientists

SBTi became the global credibility stamp.

Not just:
“We commit.”

But:
“We commit based on science.”


🌪️ CHAPTER 8 — 2020: ESG Chaos — Too Many Standards

By 2020, companies were drowning in frameworks.

A typical sustainability team had to handle:

  • GRI
  • SASB
  • CDP
  • TCFD
  • SBTi
  • Integrated Reporting
  • Local government rules
  • SDGs
  • Ratings like MSCI, Sustainalytics

Companies screamed:

“Give us ONE global ESG standard!”
“We can’t handle 200 questionnaires!”

Investors agreed.
Regulators agreed.

The world was ready for a merger.


🌐 CHAPTER 9 — 2021–2023: The Great Convergence — Birth of ISSB

Then, in a historic moment at COP26, the IFRS Foundation announced:

“We will unify global sustainability reporting.”

They created:

🌎 ISSB — International Sustainability Standards Board

ISSB became the global baseline, merging:

  • SASB
  • TCFD
  • Integrated Reporting Framework
  • CDSB
  • VRF

They launched two global standards:

  • IFRS S1 — General Sustainability
  • IFRS S2 — Climate Disclosure (built on TCFD)

ISSB adopted TCFD’s four pillars entirely and embedded them into its new global standards, IFRS S1 and IFRS S2.

This meant:
TCFD became the foundation of the world’s new sustainability reporting system.

For the first time in history:
Sustainability reporting stood beside financial reporting.

This was not evolution.
This was revolution.

2024 Onward — TCFD Officially Handed Over

By late 2023–2024, ISSB announced:

✔ IFRS S1 + S2 supersede TCFD
✔ Countries adopting ISSB automatically fulfill TCFD
✔ TCFD will be phased out as a standalone framework

But TCFD didn’t die.
It evolved — and lives inside ISSB.

🌱 In Simple Words: How TCFD Evolved

  • 2015: Born from financial crisis concerns
  • 2017: Issued world’s first climate-risk reporting blueprint
  • 2018–2020: Became the global voluntary standard
  • 2021–2022: Adopted into regulations worldwide
  • 2023–2024: Absorbed into ISSB as the global sustainability baseline

TCFD started as a framework.
It ended as the foundation of the world’s first global sustainability reporting standard.

ESG Evolution

🇮🇳 CHAPTER 10 — 2021–2024: India Writes Its Own ESG Chapter — BRSR

India watched the chaos and clarity unfold.

It decided to build something unique:
robust like GRI,
investor-friendly like SASB,
climate-aligned like TCFD.

SEBI launched:

🇮🇳 BRSR — Business Responsibility & Sustainability Report

Mandatory for top 1000 listed companies.

BRSR blended:

  • GRI
  • SDGs
  • NVG Principles
  • SASB
  • TCFD

By 2023, BRSR Core introduced assured KPIs.
India stepped onto the global ESG stage with confidence.


🇪🇺 CHAPTER 11 — Europe Goes Bold — CSRD & ESRS

Meanwhile, Europe did something unprecedented.

It launched the most ambitious ESG law ever:

🇪🇺 CSRD — Corporate Sustainability Reporting Directive

With ESRS standards that demanded:

  • Double materiality
  • Value chain transparency
  • Mandatory assurance
  • Massive data depth

CSRD wasn’t reporting.
It was transformation.

Europe didn’t just set the bar.
It built a new one.


🌈 FINAL CHAPTER — The World Today

📊 Comparison Table: ESG Frameworks vs Standards vs Platforms

Framework / StandardTypeFocus AreaMandatory?Best For
SBTiTarget-settingGHG reductionNoNet-zero targets
TCFDFrameworkClimate riskBecoming mandatory globallyClimate risk reporting
CDPDisclosure platformEnvironmentVoluntaryClimate scoring
GRIReporting standardsFull ESG, stakeholder impactVoluntary; basis for manySustainability teams
SASBStandardsFinancial material ESGNo (now merged)Investors
ISSB (IFRS S1/S2)StandardsClimate + financial material ESGBecoming mandatoryInvestors & regulators
BRSR (India)Mandatory reportingFull ESGYes for top 1000Indian companies
CSRDMandatory reportingFull ESG (double materiality)Yes (EU)EU companies & subsidiaries

🎯 How They Fit Together (Simple Mapping)

If you need:

  • Climate targets → Use SBTi
  • Climate risk disclosures → Use TCFD / IFRS S2
  • Full ESG impact reporting → Use GRI / BRSR / CSRD
  • Investor-grade ESG reporting → Use SASB / ISSB
  • Submit disclosures & get a score → Use CDP

ESG Has a Clear Map

After decades of chaos, the ESG city finally has a roadmap.

What began as scattered ideas after a tragic oil spill is today a global movement shaping:

  • how companies operate,
  • how investors invest,
  • and how the world fights climate change.

This journey was not perfect.
But it was necessary.

And now we all stand at the next chapter —
where ESG is no longer a side report

…it is the story of how businesses impact the world,
and how the world impacts business.


🌍 Call to Action: Your Sustainability Journey Starts Now

The story of ESG frameworks isn’t just history — it’s a mirror.
A reminder that every crisis changed us. Every wake-up call pushed humanity to do better.
But the next chapter is unwritten… and it’s waiting for leaders like you.

If TCFD could rise from the ashes of the financial crisis,
If SBTi could ignite a global movement for science-based accountability,
If GRI, CDP, SASB, ISSB could reshape transparency itself…

Then imagine what your organization can spark today.

👉 Don’t wait for the next crisis to define your sustainability strategy.
👉 Become the company that adapts before it is forced to.
👉 Turn ESG from compliance into competitive advantage.

Start now. Audit your ESG maturity.
Choose the right frameworks.
Align with global standards.
And write the chapter where your company becomes a sustainability leader.

📩 Need help mapping ESG frameworks for your business?
Message me — let’s co-create your future-ready ESG roadmap.

Because the world doesn’t just need better reporting.
It needs courageous organizations who choose to lead. 🌱✨

Read blogs on sustainability here.

Reference – KPMG Report

From Reporting to Predicting: How Technology Is Redesigning Sustainability for the Next Decade

Predictive Sustainability

Table of Contents

For years, sustainability lived in spreadsheets, annual reports, and compliance checklists. Companies collected lagging indicators—last quarter’s emissions, last year’s audit scores, historical waste data—and tried to piece together what went wrong and why.

But lagging indicators can only do one thing: tell you how much damage has already been done.

Today, however, something extraordinary is happening. Technologies that once powered finance, logistics, and consumer analytics are now redefining sustainability itself. Businesses are moving from passive reporting to active anticipation, from identifying risks too late to preventing them entirely.

We are entering the era of predictive sustainability—a world where companies don’t just track ESG performance; they forecast environmental, social, and supply chain impacts before they occur.

And it’s reshaping competitive advantage, regulatory trust, and brand value across industries.


The Shift: From Yesterday’s Data to Tomorrow’s Insight

Traditional sustainability reporting works like looking into a rear-view mirror:

  • “What were last year’s emissions?”
  • “How many water violations occurred?”
  • “How did suppliers perform in the last audit?”

But the world is no longer forgiving of delays. Climate risk accelerates. Supply chains stretch across continents. Regulations change monthly. Consumers respond instantly.

Reactive reporting is too slow, too shallow, and too static.

Technology changes that.
It turns sustainability into a live system, not a yearly compliance exercise. Data becomes dynamic. Insights become immediate. And companies can detect weak signals before they erupt into scandals, shutdowns, or regulatory fines.

The model has shifted from:
“Report what happened.”
to
“Predict what will happen—and act now.”


Technologies Powering Predictive Sustainability

For decades, sustainability operated like a rear-view mirror—measuring what happened after factories polluted rivers, forests were cleared, or workers were exploited.
But a new era is emerging. One where businesses not only track ESG performance—they predict risks before the world notices them.

This transformation is powered by a suite of breakthrough technologies: AI, digital twins, blockchain, IoT sensors, satellite intelligence, and advanced analytics systems.

The companies that embrace these tools are shifting from reactive to predictive sustainability—catching violations early, preventing crises, and building trust through transparency.

This blog dives into the core technologies powering this revolution—with real-world examples that show how leading companies are already using predictive systems to future-proof their supply chains, operations, and ESG performance.


1. Artificial Intelligence: The Brain of Predictive Sustainability

AI and machine learning are the engines behind the shift toward proactive risk management.
Unlike traditional ESG reporting, which compiles historical data, AI analyzes massive datasets in real time to spot ESG risks before they cause damage.

Predictive Sustainability - AI

How AI Enables Predictive Sustainability

  • Detects patterns that humans overlook
  • Flags ESG anomalies in supplier data
  • Predicts equipment failures that cause emissions spikes
  • Monitors worker welfare using digital behaviour signals
  • Forecasts climate-related risks like droughts & floods

Real-World Example: Microsoft + AI for Carbon Forecasting

Microsoft uses AI-driven carbon models to predict emissions from its cloud data centers weeks in advance.
By forecasting high-emission periods, Microsoft diverts workloads to cleaner regions—reducing total carbon output without sacrificing performance.

Real-World Example: Unilever’s AI Palm Oil Model

Unilever uses AI to detect deforestation risks among its palm oil suppliers by analyzing satellite imagery, rainfall, land-use change, and transport patterns.
The system predicts which plantations may engage in illegal deforestation before trees are cut—allowing Unilever to intervene early.


2. Blockchain: Transparent, Tamper-Proof Supply Chains

Blockchain is transforming supply chain integrity.
Why? Because sustainability fails most often in places where companies have the least visibility—tier 2, 3, and 4 suppliers.

Blockchain creates immutable, traceable records of every step in the supply chain, reducing fraud and enabling real-time oversight.

Predictive Sustainability - Blockchain technology

How Blockchain Enables Predictive Sustainability

  • Ensures full traceability of raw materials
  • Quickly identifies supply chain gaps and suspicious patterns
  • Makes audits faster and verifiable
  • Reduces risk of corruption or falsified documents

⭐ Real-World Example: IBM & Ford — Predicting Cobalt Risks Before They Become Scandals

This is one of the strongest examples of blockchain preventing ESG disasters.

Ford and IBM built a blockchain-powered cobalt traceability system to track cobalt used in EV batteries from mine → trader → exporter → smelter → battery plant.

Here’s how it predicts risk:

  1. Every batch of cobalt gets a digital identity
    Origin, miner ID, timestamp, and GPS data are recorded on the blockchain—tamper-proof.
  2. Each movement creates a new block
    Chain-of-custody records show exactly who handled the material.
  3. AI scans the blockchain for missing records
    Missing links = high risk of mining from areas with child labor.
  4. Ford receives a pre-emptive alert
    The system flagged a shipment with missing custody data.
    The shipment was blocked before entering the production cycle.

What would earlier have led to an exposé and global outrage was stopped before it happened.

This is predictive sustainability in action.


3. Digital Twins: Simulating Risks Before They Happen

A digital twin is a virtual replica of a physical system—factory, power plant, warehouse, or even an entire supply chain.

Digital twins allow companies to simulate future ESG risks, test scenarios, and see “what could go wrong” without waiting for real damage.

Predictive Sustainability - Digital Twin

How Digital Twins Drive Predictive Sustainability

  • Predict emissions spikes during peak production
  • Identify energy or water waste hotspots
  • Test sustainability outcomes of design changes
  • Model climate impacts on operations (heatwaves, floods, storms)

Real-World Example: Siemens Digital Twin for Factories

Siemens uses digital twins to simulate:

  • Energy consumption
  • Emissions intensity
  • Machine failure probability
  • Chemical leakage potential

The model helps factories predict environmental risks and schedule preventive maintenance before environmental incidents occur.

Real-World Example: Unilever’s Digital Twin for Water Risk

Unilever uses digital twins to model water availability for its factories.
If local water stress is predicted to rise above sustainable thresholds, Unilever shifts production, upgrades water recycling, or invests in local water conservation.


4. IoT Sensors: Real-Time Environmental Monitoring

IoT sensors turn factories, warehouses, farms, and vehicles into live data ecosystems.

The result? Companies see ESG risks as they emerge, enabling immediate mitigation.

IOT

What IoT Enables

  • Continuous emissions monitoring (CEMS)
  • Worker safety tracking
  • Water and waste discharge alerts
  • Noise and vibration monitoring
  • Predictive maintenance to prevent leaks/spills

Real-World Example: Shell Using IoT to Prevent Methane Leaks

Methane is 28x more harmful than CO₂.

Shell uses IoT methane sensors on wells and pipelines.
The sensors detect leaks the moment they occur, triggering auto-shutdown protocols.

Result:
Methane leakage dropped significantly, avoiding environmental fines and reputational damage.


Real-World Example: Danone Using IoT to Predict Water Use Surges

Danone installed IoT flow meters in its dairy plants and farms.
The system identifies sudden spikes in water use—often early signs of pipeline leaks or over-extraction.

This predictive capability saves millions of liters annually.


5. Satellite Monitoring & Remote Sensing: Watching What the Eyes Can’t See

Satellites now play a major role in ESG oversight, especially for risks in remote regions.

Combined with AI, satellites detect:

  • Deforestation
  • Illegal mining
  • Forced labor camps
  • Water contamination
  • Night-time light anomalies (proxy for illegal activity)

Real-World Example: Nestlé & Ferrero — Predicting Deforestation Risks in Cocoa Supply Chains

Using satellite imagery and heat-mapping:

  • Forest loss is detected in real time
  • High-risk cocoa farms are flagged
  • Procurement is paused before shipments are made

This system prevents deforestation-linked cocoa from entering the supply chain.


Real-World Example: BP Using Satellites to Predict Oil Spill Risks

BP uses satellite ocean data + AI to detect:

  • Early leakage
  • Abnormal vessel patterns
  • Chemical signatures on water surfaces

This helps prevent small leaks from becoming catastrophic spills.


6. ESG Analytics Platforms & Predictive Dashboards

Modern ESG platforms like SAP Sustainability Control Tower (SCT), Microsoft Cloud for Sustainability, and Watershed are shifting sustainability from reporting to prediction.

What Predictive Platforms Offer

  • Automated Scope 1–3 forecasting
  • Supplier ESG risk heatmaps
  • Alerts when a supplier’s ESG rating drops
  • Carbon pricing simulations
  • Climate scenario planning (e.g., TCFD)
  • Predictive compliance tracking

Real-World Example: SAP SCT for Scope 3 Risk Prediction

Companies using SCT can:

  • Predict Scope 3 emission hotspots for upcoming quarters
  • Simulate impact of supplier changes
  • Identify high-risk shipments
  • Calculate future regulatory exposure
  • Test carbon reduction strategies

This is no longer about reporting emissions—it’s about making operational decisions guided by sustainability intelligence.


7. Worker Voice Tech & Digital Labor Compliance

Worker welfare violations are usually discovered too late—after scandals break.
Technology now enables direct, anonymous worker communication.

Platforms like Ulula, OnSight, and LaborVoices allow workers to report:

  • Unsafe conditions
  • Forced overtime
  • Wage theft
  • Harassment
  • Child labor risks

These systems create predictive, bottom-up visibility into labor conditions.


Real-World Example: Nestlé Using Worker Voice to Predict Labor Abuse

Nestlé uses mobile worker surveys across farms and factories.
Patterns of complaints help them identify factories at risk before abuse escalates or becomes public.

This technology is transforming labor monitoring from annual audits to continuous feedback.


8. Predictive Climate Models: Preparing for Extreme Weather Before It Hits

Climate is now a business risk.

Predictive climate models combine:

  • historical weather data
  • climate science projections
  • local geospatial data
  • machine learning

They reveal how climate change will affect:

  • supply chain flows
  • factory productivity
  • asset life
  • water risk
  • operational downtime

Real-World Example: Coca-Cola Using Predictive Climate Models for Water Security

Coca-Cola uses climate models to:

  • forecast water scarcity near bottling plants
  • predict drought cycles
  • plan investments in watershed restoration

This prevents shutdowns and ensures operational resilience.


9. Integrated ESG Command Centers: The Future of Predictive Sustainability

Leading organizations now deploy ESG Control Rooms—centralized digital dashboards that integrate:

  • AI
  • IoT
  • satellite data
  • blockchain
  • worker voice
  • supply chain mapping

These command centers make sustainability:

  • Real-time
  • Predictive
  • Integrated into business strategy

Conclusion: From Reactive to Predictive — The Next Decade Belongs to Data-Driven Sustainability

We are entering a future where…

Companies won’t wait for environmental fines—
AI will warn them days before emissions spike.

Brands won’t wait for exposés on child labor—
Blockchain will block the shipment automatically.

Businesses won’t wait for factories to shut down due to climate stress—
Digital twins will predict future water shortages.

Sustainability is no longer about reporting what happened.
It’s about forecasting what could happen, and acting early enough to change the outcome.

The companies that win the next decade will be those that integrate predictive technologies at the heart of their ESG strategy.


🌍 Call to Action: The Future Will Reward Those Who Predict — Not Those Who React

We are entering a decade where sustainability is no longer about reporting what happened — it’s about knowing what will happen next.
The companies that thrive will be those that treat ESG not as compliance, but as intelligence, foresight, and competitive advantage.

The question is no longer:
“Are we measuring our impact?”
It is:
“Are we predicting our risks before they become headlines, lawsuits, or supply-chain failures?”

The tools exist — digital twins, blockchain, satellites, AI, IoT.
The leaders who succeed will be the ones who act now, not the ones who wait for a crisis to show them what they should have seen coming.

🚀 Your next move defines your next decade.
Build the systems.
Map the risks.
Invest in predictive intelligence.

Because the future will belong to companies that see around corners.

👉 Are you ready to redesign your sustainability strategy for a predictive world?

Read more blogs on sustainability here.

Here’s a highly credible reference link for technology in predictive sustainability:

IBM – Blockchain and Sustainability Through Responsible Sourcing:
It explains how IBM’s blockchain platform is used to trace minerals like cobalt responsibly across the supply chain, ensuring transparency and ESG integrity. ibm.com

Internal Conflicts – Do You Feel Safe to Disagree?

Internal Conflict - Hypocrisy of Manager

Fear of Internal Conflict

The Question No One Asks Out Loud

Do you feel safe to disagree at your workplace?

It’s a simple question.
But its implications run deep.

Disagreement is natural.
Disagreement is healthy.
Disagreement is the birthplace of innovation, creativity, and strong decisions.

Yet in countless organizations — from startups to multinationals — employees hesitate to voice even the smallest concern. Fear becomes stronger than truth. Silence becomes safer than honesty.

This blog is about that silence.
About the toxic cultures that punish honesty.
About the leaders who fear feedback.
And about one woman — Sushma — whose story reflects thousands of real people who silently walk away because their workplace does not allow them to disagree.


The Hidden Fear: Why People Don’t Speak Up

Before we meet Sushma, let’s understand a harsh truth:

Most people don’t feel safe to disagree at work.

Not because they lack courage.
Not because they don’t care.
But because:

  • They fear retaliation
  • They fear being labeled “negative”
  • They fear being excluded
  • They fear that truth will cost them promotion
  • They fear political games, not professional discussions

Organizations keep telling employees:
“We welcome your feedback.”

But employees know the reality:
Some truths are punishable.

And some managers want only positive feedback disguised as “team spirit.”


Meet Sushma: The Quiet Perfectionist Who Truly Cared

Sushma was the kind of employee managers should dream of.

A high-performing individual.
A perfectionist in the best sense.
A believer in continuous improvement — in herself, her work, her team, and her company.
She wasn’t political.
She was straightforward.
She was simply committed.

She loved improving things.
She believed in processes.
She believed that feedback is a gift.
She believed that honesty and improvement must go hand-in-hand.

Every retrospective, every process review, every meeting — she showed up thoughtfully.
She wrote down suggestions based on experience, root-cause analysis, and genuine care for customers.

She thought she was doing the right thing.

But the right thing is not always the safe thing.


The Manager Who Said “Give Feedback” — But Didn’t Mean It

Her manager, a mid-level leader, often preached about “openness,” “teamwork,” and “improvement culture.”

“We are a transparent team,” he repeated.
“We grow through feedback,” he insisted.
“Everyone should share honestly,” he emphasized.

He encouraged people to put ideas on whiteboards, vote on improvements, challenge existing processes.

Sushma took these words seriously.

And that was her mistake.

Because the manager didn’t want feedback.
He wanted praise.
He wanted validation.
He wanted loyalty disguised as professionalism.

The moment he read her improvement suggestions, the atmosphere shifted.


The Turning Point: When Honesty Became Threatening

Internal Conflicts-Disagree - Resignation - Office Culture -

At first, he simply ignored her feedback.

Then he started avoiding eye contact.
Then he began interrupting her in meetings.
Then he rolled his eyes when she spoke.
Next came the sarcasm:
“Oh, another improvement idea from you?”
“Maybe you should focus on your tasks instead of pointing out issues.”
“You always think negatively.”

Sushma was confused.

She had only written observations like:

  • Customer pain points
  • Communication delays affecting customers
  • Inefficient internal handovers
  • Repetitive errors caused by unclear processes
  • Missing quality checkpoints
  • Better ways to collaborate within teams

Nothing personal.
Nothing exaggerated.
Nothing emotional.
Just facts.

But facts were his enemy.

Because feedback without flattery felt like an attack to him.


The Hypocrisy Becomes Visible

Slowly, the mask fell off.

This manager praised the culture of “openness” yet punished openness.
He invited suggestions yet resented them.
He encouraged discussion yet demanded obedience.
He asked for honesty yet rewarded flattery.

In meetings, he smiled.
In one-on-ones, he showed his real face.

“Sushma, your feedback is too negative.”
“You come across as aggressive.”
“Leaders don’t like people who complain.”
“You should learn how to talk to managers.”

Sushma felt suffocated.
Her integrity was being attacked.
Her intent was being twisted.
Her improvements were being labelled as rebellion.

But that was only the beginning.


The Politics: The Silent Revenge for Speaking Up

It started subtly.

Her workload increased without explanation.
She was excluded from informal conversations, ignored.
Her achievements went unrecognized.
Her name was dropped from important emails, events.
Her responsibilities were reduced.
Her growth opportunities vanished.

Her promotion denied.

Soon, colleagues were told quietly:

“She has an attitude.”
“She is too aggressive.”
“She criticizes the team.”
“She is not aligned with the manager.”

People began distancing themselves from her, afraid of being on the “wrong side.”

The manager had created a trap — rewarding those who praised him and isolating those who dared to disagree.

It was a culture where flattery led to promotion and honesty led to punishment.


The Breaking Point: When Speaking Up Becomes a Liability

One afternoon, in a one-on-one, the manager said something that broke Sushma’s heart:

“You should stop giving improvement suggestions.
Just highlight positives.
Focus on praising what works.
That’s what makes your manager happy.”

Her mind went blank.

She wasn’t being asked to improve her communication.
She wasn’t being asked to be constructive.
She was being asked to stop thinking.

To stop caring.
To stop being herself.
To stop being honest.

In that moment, she realized the truth:

This wasn’t a place for improvement.
This wasn’t a place for honesty.
This wasn’t a place that valued customers.
This wasn’t a place that valued integrity.

This was a place where truth was treated as aggression, and silence was rewarded as maturity.

She silently left the room with tears she didn’t want to show.

Not tears of weakness — but tears of clarity.


Her Decision: Leaving Was Not Running Away — It Was Standing Up

Internal Conflict - Resignation - Respect at Work

After 4 years of emotional erosion, isolation, and political punishment, Sushma resigned.

She didn’t fight.
She didn’t argue.
She didn’t justify.
She didn’t explain.

She simply walked away.

The manager kept smiling looking at her feeling happy about his victory.

Victory of seeing only yes man in the team after Sushma’s exit.

Victory of seeing all praise the manager so he gets promotions.

Some colleagues whispered,
“She was too sincere for this place.”

But deep down, everyone knew the truth:

The company had lost a rare gem.
The team had lost its conscience.
The manager had lost the one person who genuinely tried to make things better.

Sushma didn’t just leave a job.
She left a culture that feared truth.
She left a system that punished improvement.
She left leaders who could not handle honesty.

Most importantly, she left for her own mental peace, self-respect, and future growth.


The Bigger Question: Why Does This Keep Happening?

Sushma is not alone.
This story repeats every day in thousands of workplaces.

The problem is not disagreement.
The problem is how disagreement is punished.

Many companies say:

“We support open culture.”
But they silence dissent.

“We welcome feedback.”
But only if it praises leadership.

“We encourage improvement.”
But only if it doesn’t question existing systems.

The result?

  • Innovation dies
  • Good employees quit
  • Toxic managers rise
  • Groupthink becomes culture
  • Customers suffer
  • The company stagnates

Disagreement is the lifeblood of a healthy organization.
But only if people feel safe to express it.


What Psychological Safety Truly Means

Psychological safety is not about being “nice.”

It is about:

  • Allowing people to disagree without fear
  • Encouraging debate and diversity of thought
  • Rewarding truth over flattery
  • Accepting uncomfortable ideas
  • Respecting questions, not punishing them
  • Removing politics from feedback
  • Building trust, not hierarchy-based fear

Google’s Project Aristotle proved one thing:

Teams with high psychological safety outperform every other type of team.

Not because they agree all the time.
But because they disagree — openly and safely.


How Leaders Can Should Treat Disagreements

Here are behaviors that build trust instead of fear:

1. Respond, don’t retaliate

Thank people for honesty, even when it’s uncomfortable.

2. Reward improvement-oriented feedback

Promote those who think critically, not those who flatter.

3. Normalize disagreement

Say things like:
“Who has a different perspective?”
“What can we improve next time?”

4. Remove ego from leadership

Leadership is not about being right — it’s about enabling what’s right.

5. Stop labeling people as “negative”

Challenge the problem, not the person.

6. Build inclusive discussions

Give everyone equal opportunity to speak.

7. Make feedback a two-way process

Leaders should also receive feedback, not only give it.

When leaders create safety, people don’t fear honesty — they embrace it.


What Employees Like Sushma Teach Us

Employees like Sushma are priceless.

They:

  • Think deeply
  • Care genuinely
  • Improve consistently
  • Speak responsibly
  • Challenge the status quo
  • Push for quality
  • Stand up for customers

If organizations cannot retain such people, the problem is not the employees.

The problem is leadership.

When honest people leave, companies lose:

  • Integrity
  • Innovation
  • Intelligence
  • Courage
  • Insight
  • Growth potential

No business strategy can compensate for the loss of good people forced out by bad managers.


Conclusion: The Real Question Organizations Must Ask

So, let’s return to the question:

Do you feel safe to disagree at your workplace?

Your answer reveals more than your comfort level —
It reveals your workplace culture.

If the answer is no, then your organization is not growing — it is surviving on silence.

If the answer is yes, then your organization is on a path of genuine innovation and trust.

Sushma’s story is not just a story.
It is a mirror.
A wake-up call.
A warning.
And a reminder:

People don’t leave companies.
They leave managers who punish truth.

The world needs more leaders who welcome disagreement — because disagreement is not a threat.
It is a gift.
It is courage.
It is commitment.
It is the foundation of progress.

And if you are a leader reading this:
Ask yourself — Do your people feel safe to disagree with you?

Their silence is telling you more than their words.

Read more blogs on sustainability here.

References:

🔗 Harvard Business Review – “What Psychological Safety Looks Like in a Hybrid Workplace”
https://hbr.org/2021/02/what-psychological-safety-looks-like-in-a-hybrid-workplace

Deloitte – “Barriers to Breakthrough: Why Psychological Safety May Not Be Enough” (Deloitte article) Deloitte

McKinsey & Company – “What is Psychological Safety?” McKinsey & Company

McKinsey – “Psychological Safety and the Critical Role of Leadership Development” McKinsey & Company